Causeway Solutions Outlooks and Insights: Volume 2, 10/21 - Instant Insights
Causeway Solutions
Newsletter, Polling, Retail, Holiday, Analytics
October 1, 2021
Instant Insights
What do your Holiday Shopping Habits Say About You? Did you know that if you start early, you are more optimistic than those who wait?
With October officially here, the country is getting into the fall season, surrounded by pumpkin-flavored goodies, Halloween decorations, and fall-themed decors. Another season is also about to start, the 2021 Holiday Shopping Season! The thought of holiday shopping puts many consumers into a frenzy, but the newest edition of Causeway Solutions Instant Insights sheds light on what your Holiday List approach says about you. As it turns out, shopping habits for the holidays are as different as the shoppers themselves.
This month’s Instant Insights poll of 600 Americans asked at what point in the holiday season does your shopping begin. The results showed that the three most popular choices are the following:
- Between Thanksgiving and Christmas “Traditionalists” at 26%
- Before Thanksgiving “Early Birds” at 25%
- Black Friday at 21%
And what does your Holiday Shopping Habit say about you?
Before Thanksgiving Shoppers “Early Birds”
Early-bird shoppers are the most optimistic group, with 58% saying they are satisfied with the direction of the country. They are also more likely to be married, have a higher income, and are the most educated of all three groups. When they are ready to pay for their purchase, they have a traditional approach with 79% reaching for cash/debit and 65% for credit they will be spending especially since 41% say they are planning on spending more this year than in a typical holiday season. But don’t let this optimism infer they are ignoring economic indicators as 52% said they are concerned with supply chain issues and plan to shop even earlier than usual.
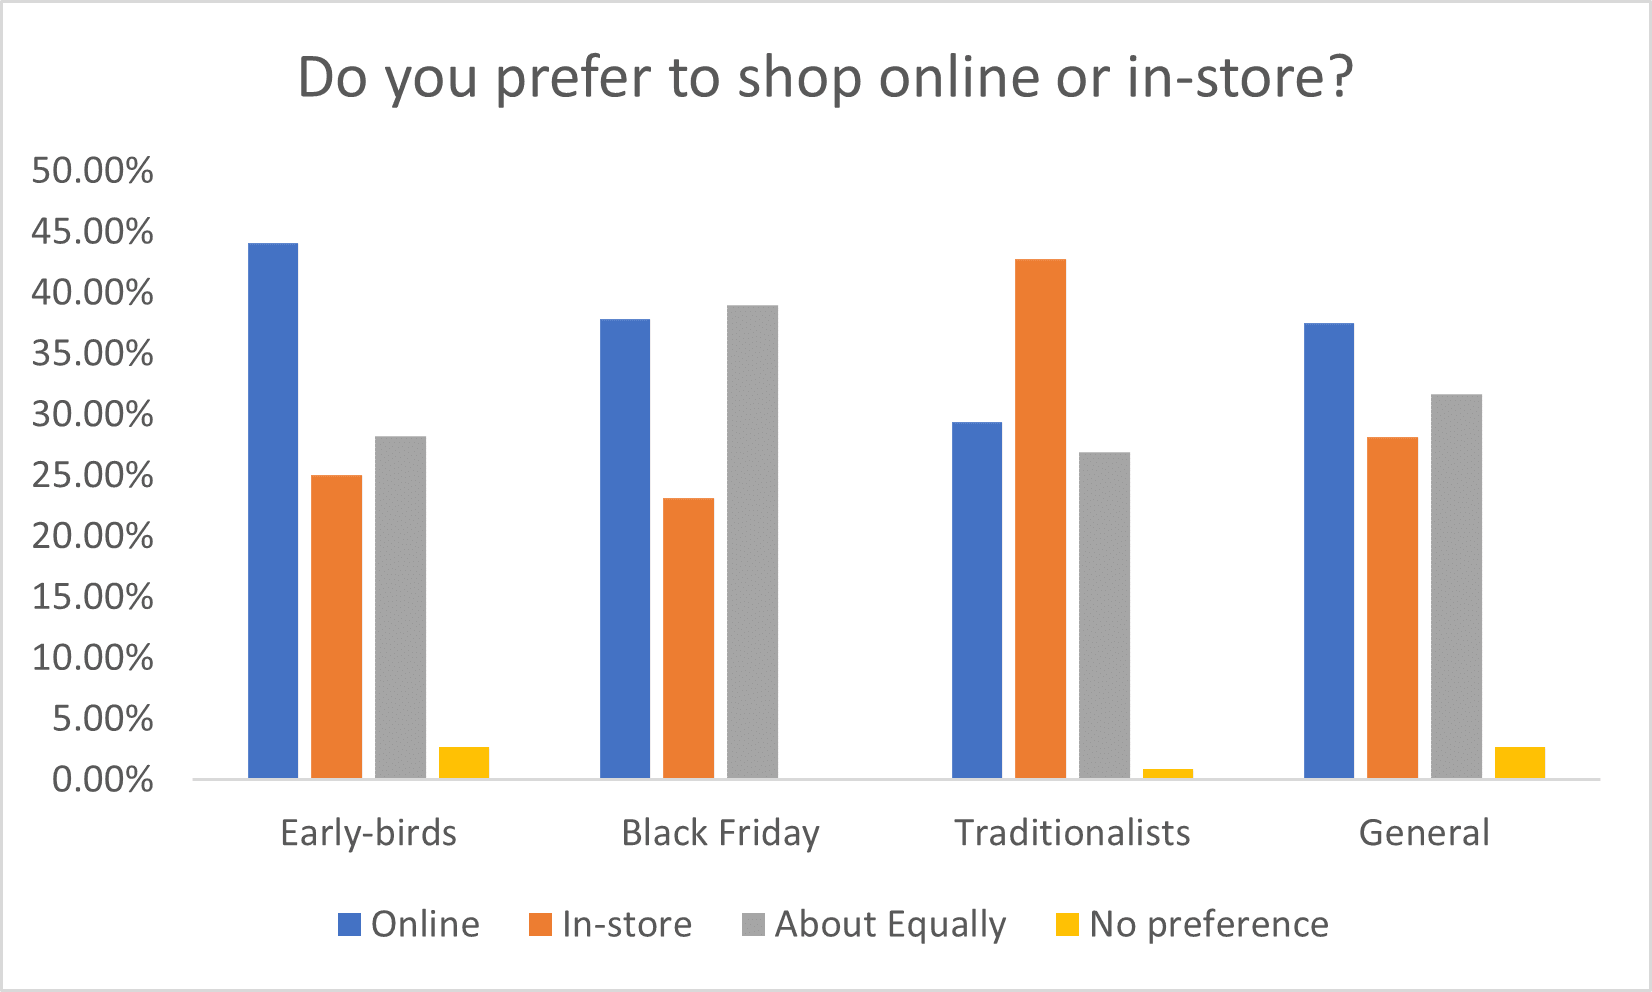
Early-birds also value convenience, they prefer online shopping (44%) over in-store shopping (25%) but despite this preference, they like to try out new products in person at 55% compared to the 37% average, and over half say they shop Amazon at least once a week. Early Birds are smart shoppers and very prepared, they read online reviews and compare different sellers. Smart and early shopping must work up an appetite since 40% subscribe to a food delivery box compared to only 29% of the general population.

Black Friday Shoppers
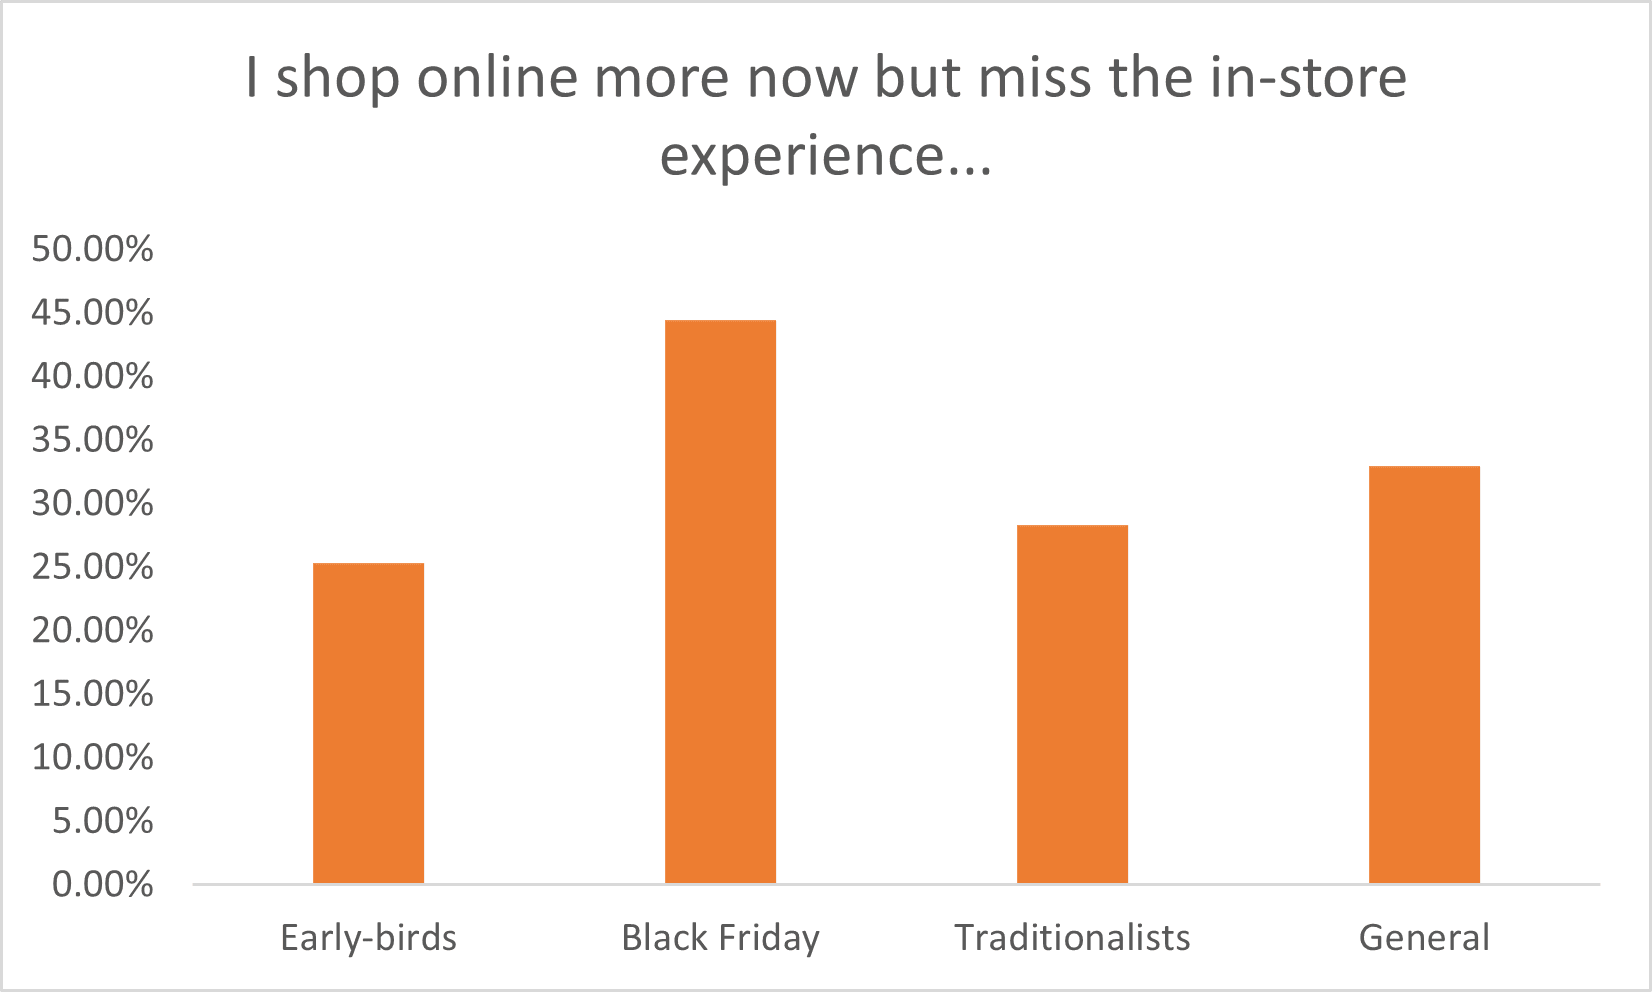
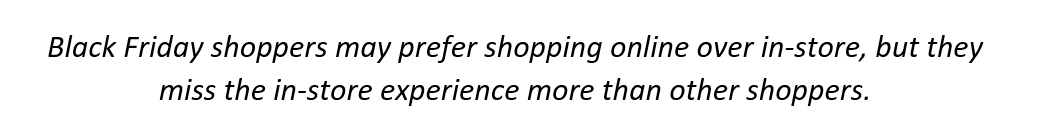
Black Friday shoppers are also unique! Slightly younger than the average, they are more likely to be single, a little less affluent, and much more digitally savvy. Their confidence in the economy shows as two-thirds plan on spending the same amount or more this year, and many believe that prices on goods and services have decreased. Despite saying they have no preference between in-store or online shopping experience, they are very attached to their phones. Eighty-five percent use cell phones for purchases, 68% buy through social media and 77% use their phones to compare prices and read reviews while shopping. Given their affinity for the phone, it is not surprising that they are more active on social media than the average, especially on Twitter, Tik Tok, and Snapchat. Fifty-one percent use Amazon as a go-to starting place for online shopping which is actually lower than the general population, but they are more likely than the average to use specific online store websites like Walmart and Target at 35%. When this group gets hungry, they are quick to adapt to new ways of food delivery, as they were more likely to continue the behaviors, they started during COVID of using grocery delivery services like Instacart, FreshDirect, or Walmart Grocery compared to other shoppers.
Between Thanksgiving and Christmas “Traditionalists”
Traditional Holiday shoppers are very different from both Black Friday and Early Birds. Sixty-one percent are dissatisfied with the way things are going compared to only 44% of the general population. They are similar to the average when it comes to income and education, but they are far more likely to prefer in-store shopping at 43% compared to only 28% on average. This is true every month of the year. Over half of the Traditionalists say they will be spending the same as last year rather than more and when they do, they will use cash or debit as they are averse to newer options such as digital currency or phone payments. Unlike the Black Friday shopper, they are less likely to use a cell phone for purchases. When they are ready to buy, they don’t need recommendations from people they don’t know or even those they do! At the end of the day, this group will be going to the grocery store in person when their shopping is done. They are far less likely to subscribe to food subscriptions services or online grocery delivery.
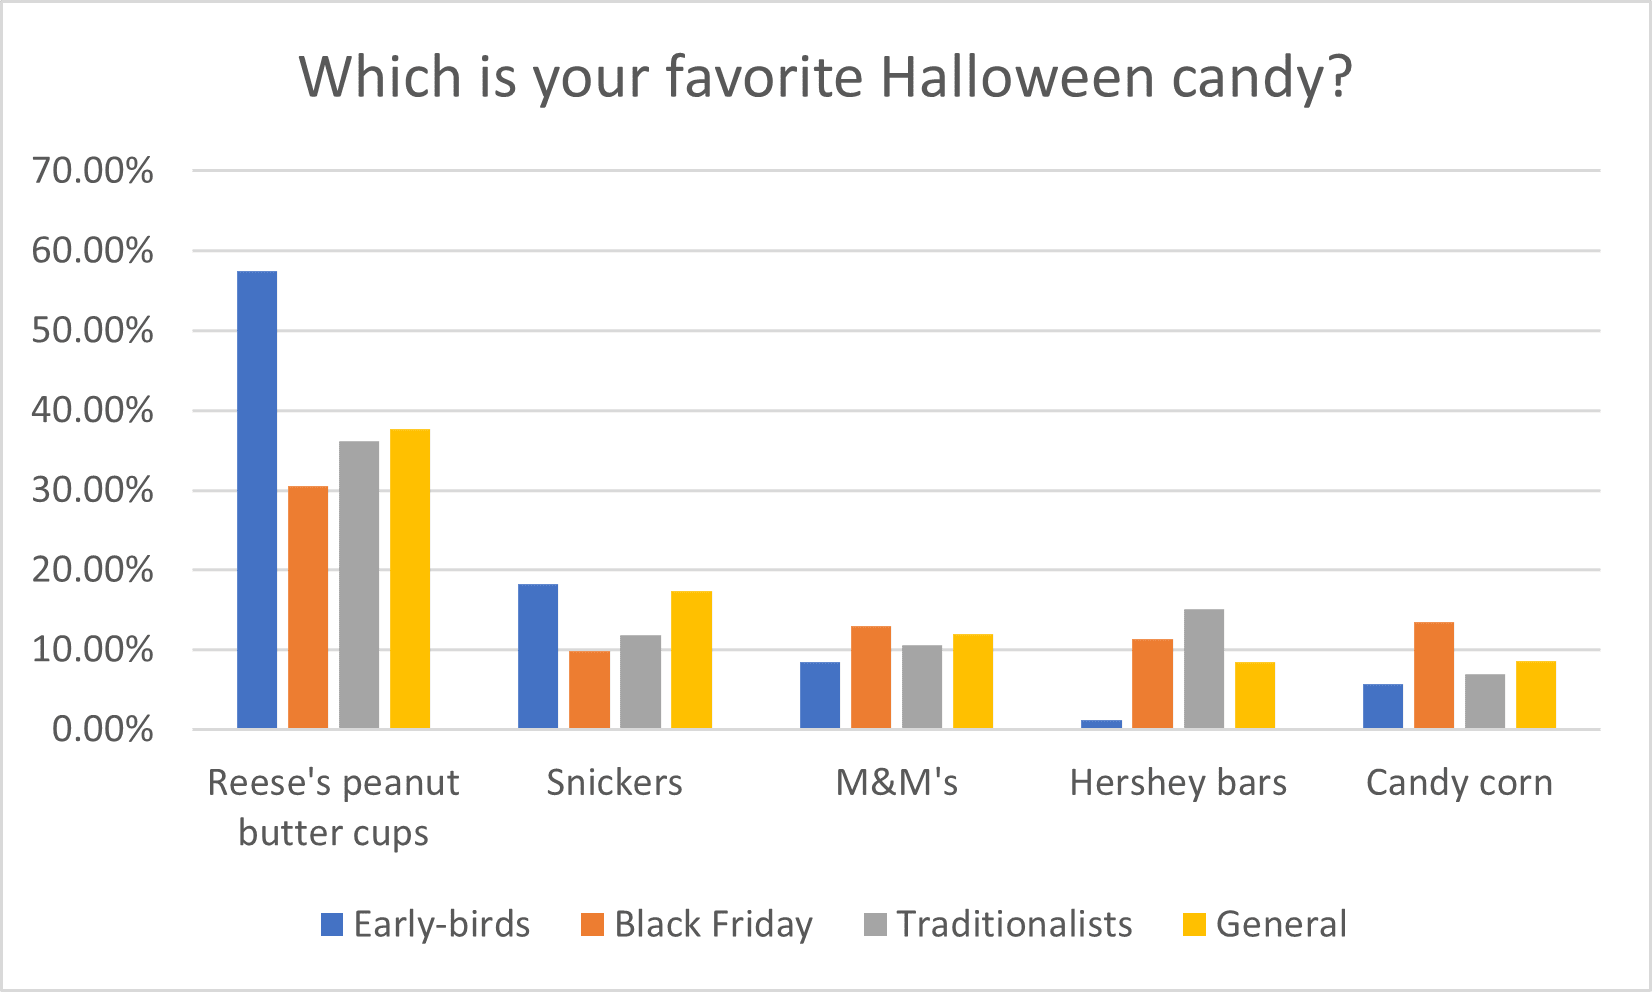
With all of these differences, between the three shoppers profiled is there anything that solidly unites them? Miraculously, yes, thanks to our next major holiday…Halloween. Given our love of all things sweet we asked people a very important question – “What is your favorite Halloween candy?” The results were astounding and unanimous because all three groups, along with the general population, unanimously voted for our all-time favorite, Reese’s Peanut Butter Cups winning first place with 30-57% of the vote. Even beyond shopping habits, be it age, gender, or political affiliation, the United States is united! So come together and enjoy the candy that brings us all together before the hustle and bustle of this year’s Holiday Season!

Ready to learn more? Contact Causeway Solutions to get started!