Data Storytelling in the Beauty Industry
Catharine Szefcyk
Data, Beauty Industry, Analytics
July 31, 2023
Data Storytelling in the Beauty Industry
Global revenue in the beauty and personal care industry amounts to $571 billion in 2023 and is projected to reach $784 billion by 2027 [1]. With more and more people across the nation buying personal care and beauty products, the beauty industry is growing at a rapid speed. That said, understanding and anticipating consumer habits – through data analysis techniques – is vital.
Data is all around us – and more and more people have access to software that is designed to help us make sense of it. That’s great and all, but it’s not enough to just analyze numbers in spreadsheets. It’s equally important to communicate the meaning behind the numbers and options for next steps in a clear, concise manner that’s engaging and impactful-also known as data storytelling.
Data storytelling refers to the practice of using data and visualizations to tell stories in a way that communicates insights, trends, and information that help companies make data-driven decisions.
The following beauty industry analytics help companies gain a competitive edge and establishing stronger connections with consumers:
- Consumer Analysis: Revealing key demographics and insights about consumer behavior and trends that can help beauty brands understand what drives consumer choices and tailor their marketing strategies.
- Market Trends and Forecasting: Market research, sales figures, and industry reports can provide a comprehensive view of the market landscape and identify growth opportunities.
- Product Performance and Analysis: Sales data, customer reviews, and user satisfaction ratings can identify successful products, understand customer preferences, and make data-driven decisions regarding product development, marketing strategies, and inventory management.
- Brand and Influencer Analytics: Brand awareness, social media engagement, influencer reach, and campaign performance allow companies to assess the effectiveness of their marketing strategies and partnerships.
This information helps businesses identify areas where they can differentiate themselves, improve their offerings, or adjust their strategies.
What do we do with this information?
It’s imperative to present the information gathered in a compelling narrative format. There are three key things to consider so that data presentations and reports effortlessly lead decision-makers down the right path.
1. Who is the audience?
The #1 question when defining the data story is to keep the audience in mind. Because there are so many different segments in the beauty industry, it’s important to consider the following:
- Relevance - Are these insights relevant to the audience
- Consideration - What opportunities need to be considered?
- Depth - Do they want details or simply a broader overview?
- Scope - Do they need historical, present, or forecasted data?
2. What is the narrative?
Now that we’re equipped with a clearer understanding of the audience and their interests, it is time to clarify the building blocks that uncover and highlight the key metrics and insights through display and visualization.
Let’s look at the difference in visualizations and how the same data set can tell different stories depending on what the audience is interested in learning, and what key metrics and insights are in question.
2023 Consumer Data Set
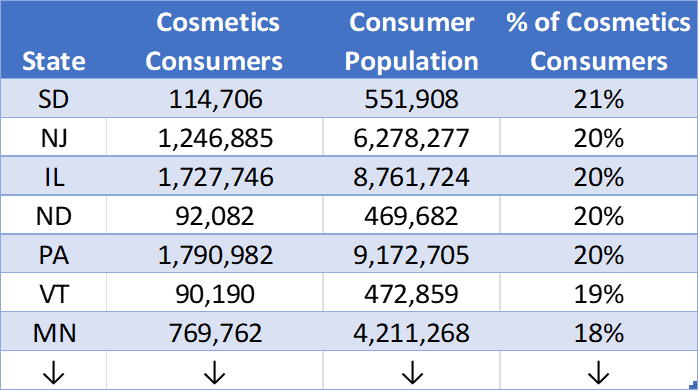
Visualization of the data set through geographic heat maps:
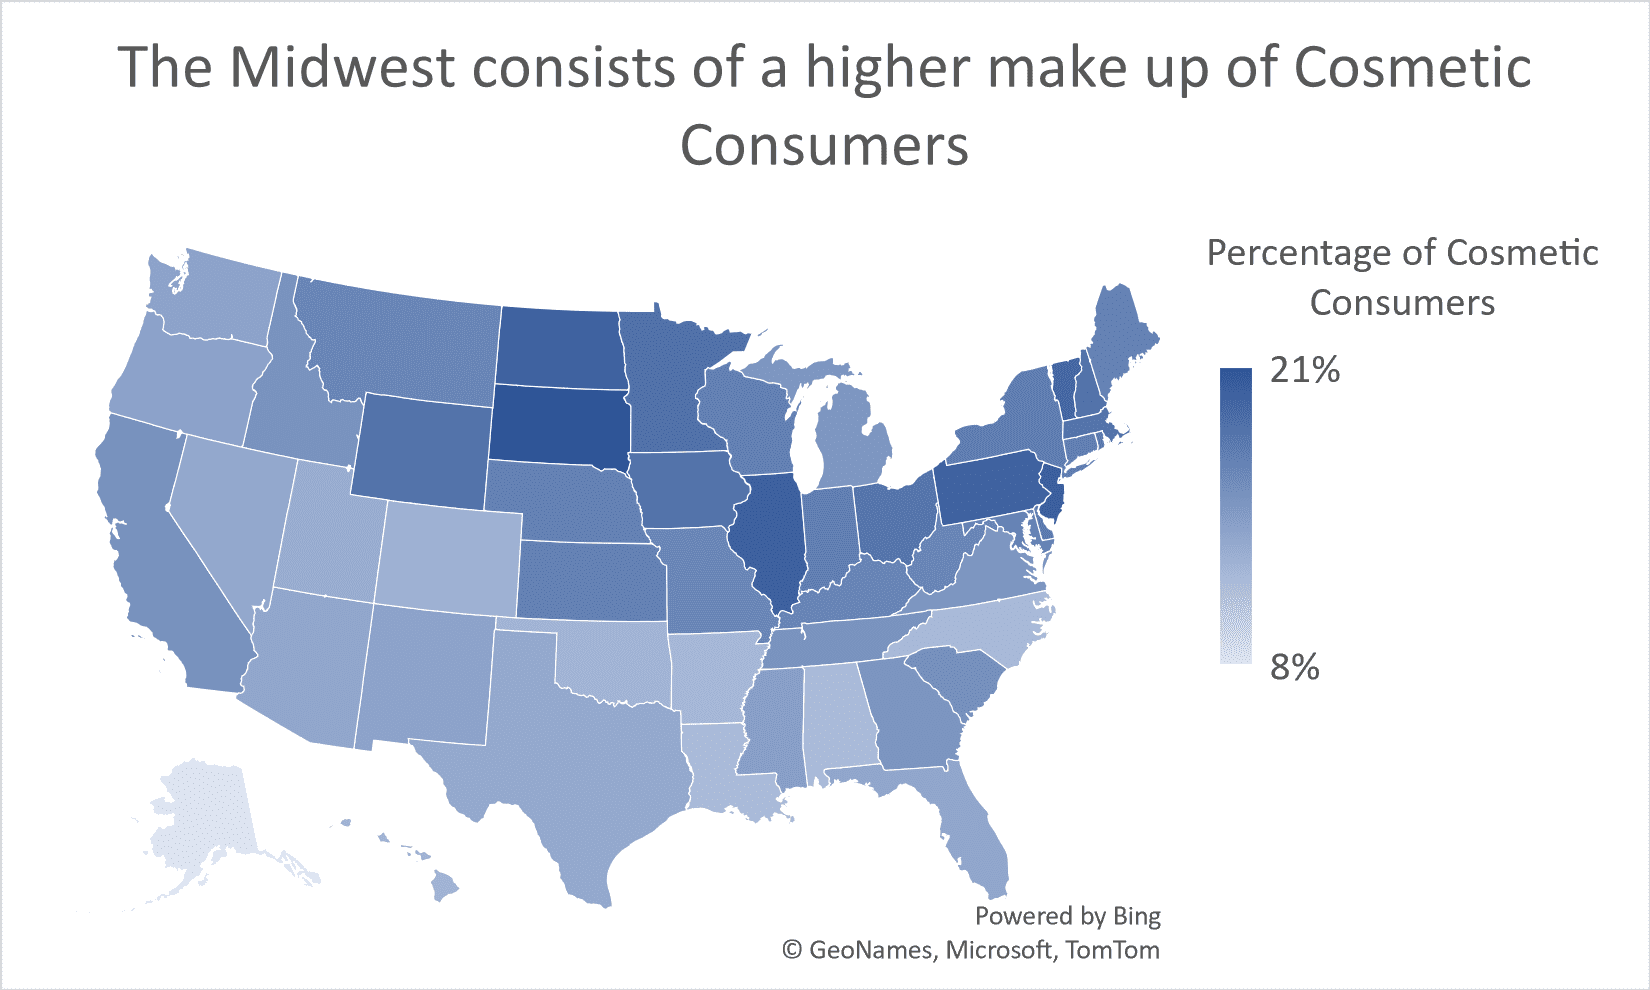
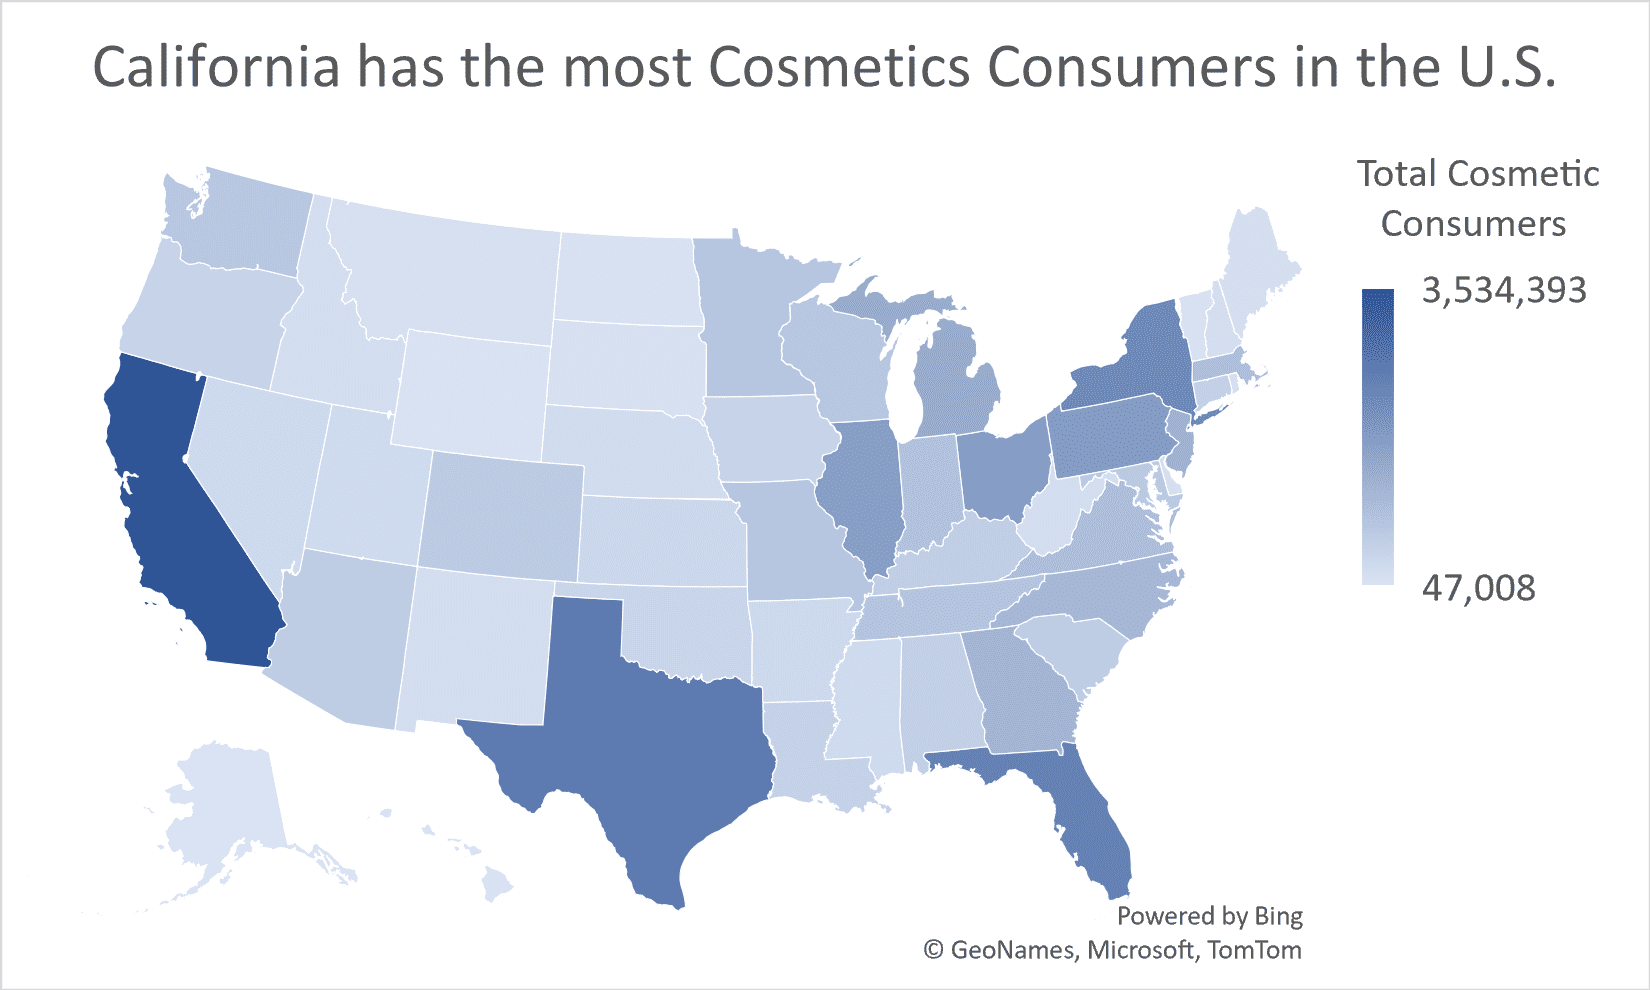
Note how just three columns of a raw data set don’t tell us much. But once visualized, the information offers more than one story and generates different takeaways depending on the goals of the audience.
3. What are the next steps?
A data story should always point to how it can help support an action or change that will help the business. In the above example, beauty industry stakeholders may want to adjust marketing initiatives based on where consumers live. There is no right or wrong way to use the data, but there are certainly different ways to consume it.
Let Causeway Solutions tell your story!
Data storytelling adds a human touch to numbers and stats. With the growing use of technology, harnessing the power of available data is crucial. At Causeway Solutions, we assist our clients in the creation of digital dashboards, custom reports, and presentations that support decision making, refine marketing programs and increase the effectiveness of advertising campaigns. Contact us to learn more and request a complimentary Discovery Session.
Source:
[1]: “Beauty & Personal Care - Global | Statista Market Forecast”
To learn more, visit Causeway Solutions to get started!