The Next Battle in the Streaming Wars
Lauren Kornick
Data, Entertainment, Streaming
October 26, 2021
The Next Battle in the Streaming Wars
The streaming wars are upon us! The last two years have caused an upheaval in Hollywood, with the traditional tv and movie business in flux as studios attempt to adjust to altered viewing habits. Even without the pandemic, growth in the digital markets has already shown its effect, tripling digital subscriptions over 5 years. The subscription market has even made strides in the professional sense, racking up nominations and wins for prestigious awards like the Oscars or Emmys. However, truly measuring the success or impact of streaming releases has been new ground to cover in the entertainment industry. What are some data tools that people can use to try to capture the true amount of success for content from these streaming services?
Streaming Shift
Subscription services have been building up in both qualitative and quantitative ways. Netflix crossed the 200 million subscriber mark, while Disney+ became one of the streaming leaders with over 100 million subscribers in only two years. Causeway Solutions’ surveys conducted in 2020 and 2021 revealed almost two-thirds of people have used streaming services to watch movies versus only 30% who went to a theater or 38% who used traditional video on demand. Our internal data also shows a solid 17% of consumers who only stream tv rather than watch any tv live.
Beyond quantitative data, shifts in the entertainment industry also show the success of the streaming market. Major studios have embraced streaming services as legitimate outlets, using them as exhibitors for some of their formerly theater-exclusive films. Films and television shows exclusively for streaming services are now recognized by prestigious industry award shows, such as the Primetime Emmy Awards and the Academy Awards. A-list talent and millions of dollars of support now go into the production of original streaming content once seen only on cable television or feature films. The number of new audience members and the shifts of focus in the industry itself illustrate the success streaming services have had creating a competitive advantage in the industry while creating a totally new industry at the same time.
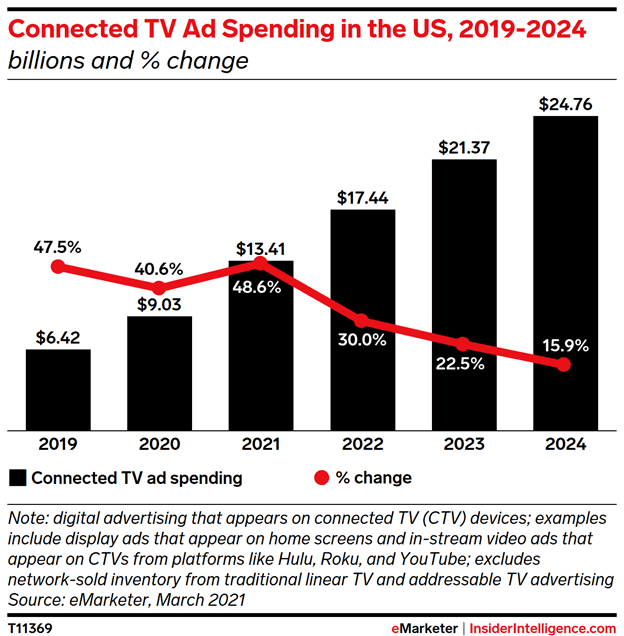
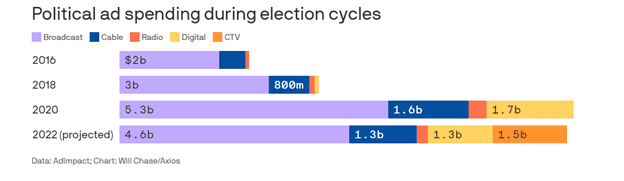
This shift is especially evident in the advertising market, with CTV (Connected TV) ad spending increasing and projected to continue.
Even data connectivity platforms are taking notice and adapting. For instance, LiveRamp recently announced their enhanced TV platform that adds streaming inventory forecasting and data collaborations capabilities to ensure that people can continue to get the most out of first-party data.
But what are the streaming audiences actually watching? Are there ways to measure success outside of what the streaming services tell us?
Measuring Success
Beyond just the success of streaming services, how do we measure the success of a show or movie that is on streaming beyond the number of service subscribers? Trending topics on social media or trending content on the service only gives us a glimpse of the story, but what other options are there?
Nielsen, an industry leader in this data, has recently relaunched their streaming measurement suite while covering even more streaming homes for platform and content ratings as well as measurements for CTV ads. Their reports give us breakdowns of minutes watched per content, viewing habits and rankings, and more.
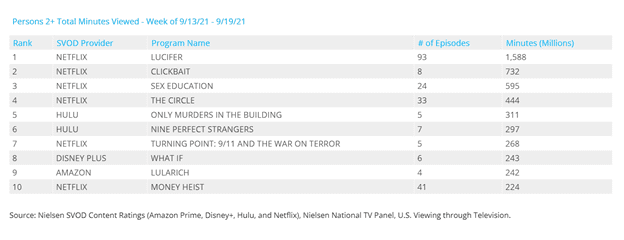
For instance, for the week of September 13th through September 19th (the most recent ratings report at the time of writing), we can see the top 10 results for new content in terms of minutes watched. For rankings, we can see the noted “winners” for the week including the release of the new seasons of Netflix’s Lucifer and Sex Education (the former ending the series and the latter renewed for a new season), along with notable popular offerings from Hulu such as Only Murders in the Building and Nine Perfect Strangers (the former renewed for a new season and the latter reportedly Hulu’s “most-watched original ever”) and Disney+’s What If (also renewed for a new season).
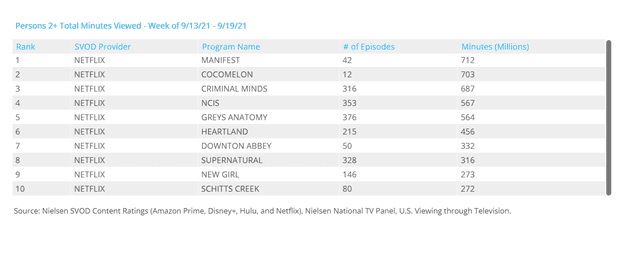
The top 10 results for acquired content are also available which we can use to understand decisions such as Netflix picking up Manifest after its network cancellation.
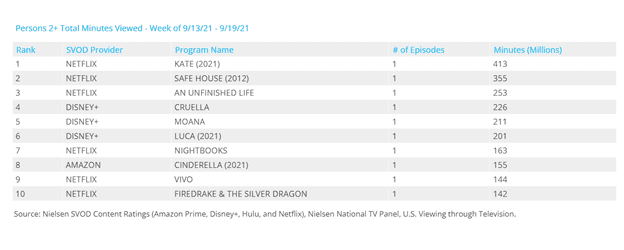
Lastly, we see the results for streaming movies, both acquired and original. Netflix’s continuous stream of new films help to lead the list, followed by Disney+’s brand of previously released family films and the significant staying power of Amazon Prime’s Cinderella.
Although not perfect, Nielsen’s methods seem to be a step in the right direction, with even Netflix announcing new methods of releasing ratings that resemble Nielsen’s reports.
Other data companies have also come forward to shed more light on content success for services. For instance, new data company Antenna Analytics measures subscription metrics, giving analytics for which content drives subscriptions to the services. This is another good indication of “success” at least from the service’s point of view.
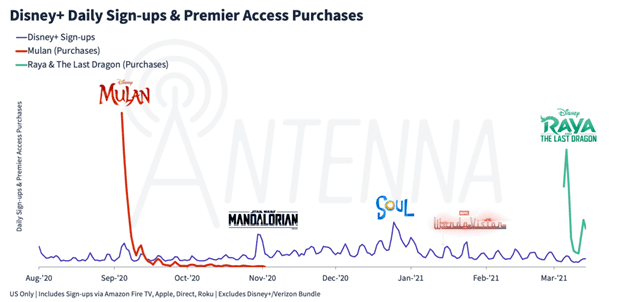
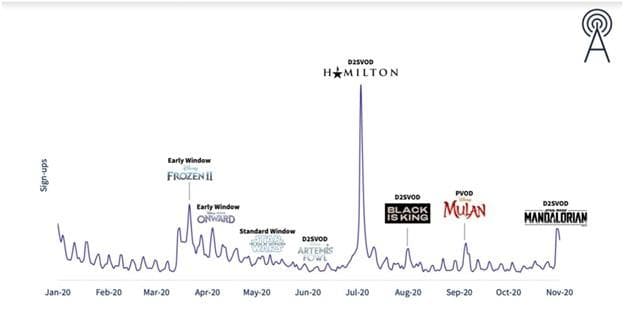
A previous release of data on sign-ups and purchases showed some results of Disney+’s Premier Access releases. Further analysis from Antenna gives interesting insight into the purchasing results, such as 60% of purchases for Raya coming from subscribers on the original launch date and 70% for purchases of Mulan. For subscription drivers, we can see that new free content such as The Mandalorian and Soul increased subscription rates more than premier access purchases, and neither of the two matched the true driver for Disney+’s initial increase in subscriptions, Hamilton, released back in July 2020.
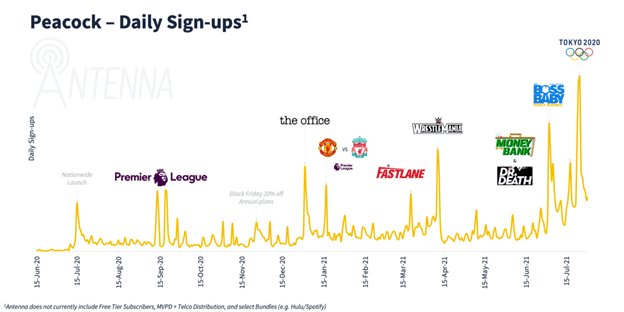
Another interesting chart looks at the sign-ups for Peacock which show the significant influence for services comes not only from original content or valued brands, but also from live television events like WrestleMania, Premier League, and the Olympics.
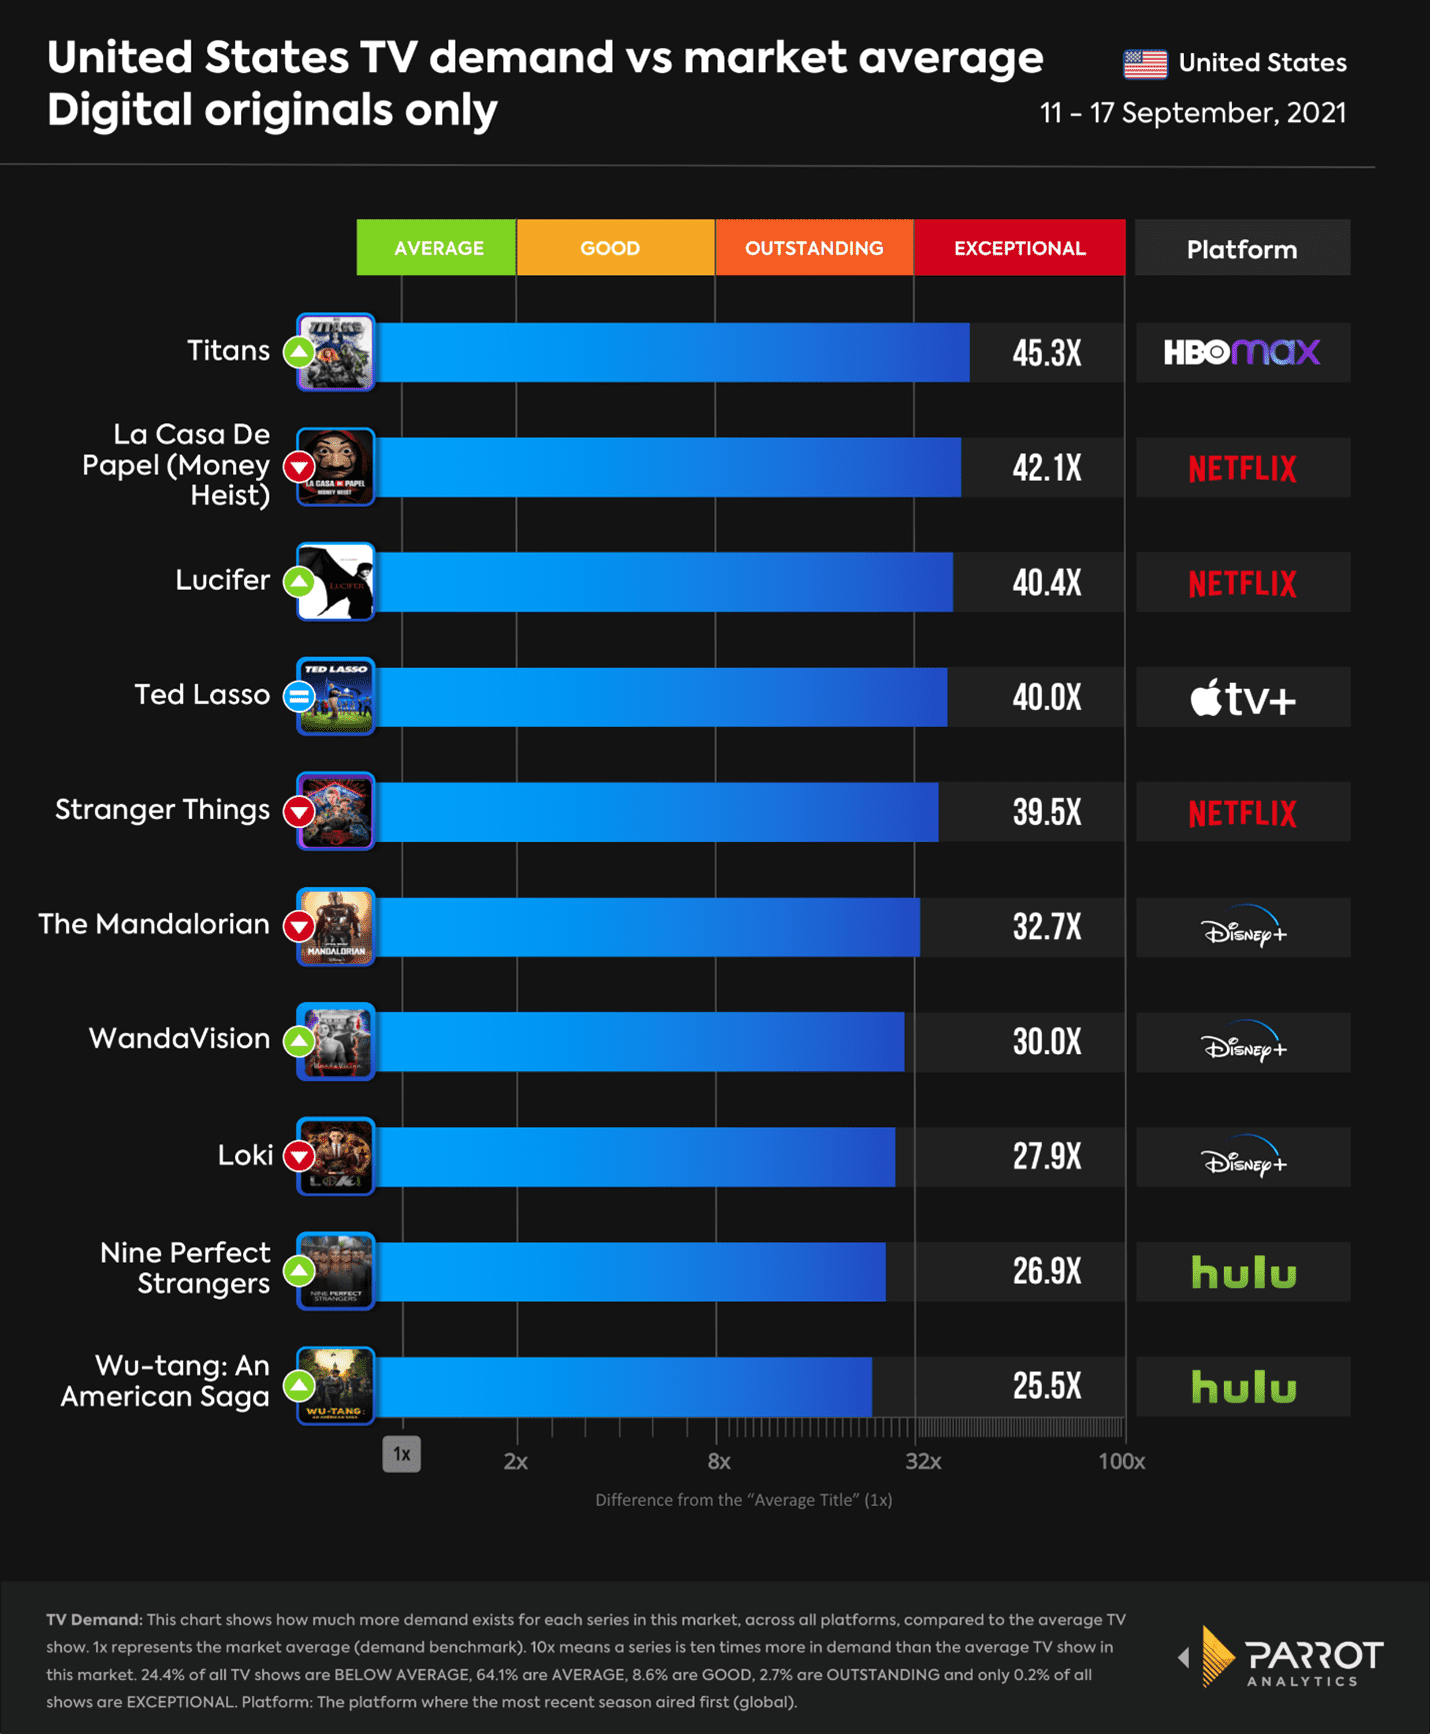
Parrot Analytics has also come forward to change the conversation on content measurement, namely focusing on audience demand for content. They report for audience demand of tv and digital original demand compared to the market average to follow trends of content interest. Tying together research, video statistics, P2P streaming statistics, social media buzz, and the tv market, they look at direct audience demand rather than strict viewing numbers. We can compare their findings to Nielsen’s report from the same time frame.
We can clearly see some overlap between the two reports, such as the rankings for Money Heist, Lucifer, and Nine Perfect Strangers, along with some insights on demand for content and services not included on the Nielsen list, such as Ted Lasso from Apple TV+.
Potential Problems
Part of the problem with having a standard of success for content, however, is the issue of transparency and consistency from streaming services. Services often withhold numbers of viewers, saving partial reveals for projects they feel confident in, or feel are successes. They also use different qualifications of “views,” making it difficult to determine apples-to-apples comparisons between content from different services. HBO Max touts The Suicide Squad’s “second-most-viewed movie debut” of the service, Paramount+ says Paw Patrol: The Movie is “ranked as one of the service’s most-watched originals,” and Netflix continuously praises their most “viewed” shows, despite their previous viewing metrics involving tallying accounts that watch content for only at minimum two minutes.
Even third-party data sources bring comparison issues. For instance, back in December, Warner Media and Disney went head-to-head with Christmas content, releasing Wonder Woman 1984 on HBO MAX and Soul on Disney+, both for no extra cost. In a rare move, HBO Max shared their viewership data with Nielsen to include in their viewer report, and it revealed that Wonder Woman 1984 “won” the weekend with a 35% higher viewership than Soul, at 2.252 billion minutes versus 1.669 billion minutes. However, considering runtimes, the estimated amount of “times watched” actually comes closer to equal (with Soul even potentially having more “times watched”). Similar comparisons also appear when comparing streaming programs to each other or even to network television. Despite the content topping the lists for Nielsen and showing some success, it also sadly reveals that there are holes when creating new metrics.
Conclusion
Streaming is projected to continue growing, with analysts estimating 1.64 billion subscriptions by 2026, an increase of over 300% Ad spending is also projected to grow for CTV, especially for the upcoming 2022 midterms.
With this growth comes changes in measurement tools to answer who the “winners” are and how to see where audiences are actually going. Previous methods of measuring success like the box office or Nielsen are adapting their procedures to try to piece together the streaming service audiences while new types of audience insights from Parrot Analytics or Antenna Analytics also illuminate the path that companies can take for audience targeting. As streaming services gain more ground in the future, we hope to see more transparency in the data, such as Netflix’s recent announcement on releasing ratings data, just as the release of box office numbers changed the game for entertainment analysis. As data improves, we will get more clarity of the streaming wars “behind-the-scenes” and discover better ways to target and measure our audiences for messaging going forward.
To learn more, visit Causeway Solutions to get started!