Throwback Analysis: Is Netflix the “Facebook” of Streaming Services?
Lauren Kornick
Causeway Media Connection, Consumer Insights, Audiences
October 21, 2024
Throwback Analysis: Is Netflix the “Facebook” of Streaming Services?
Almost 2 years ago, Causeway Solutions shared insights on social media and streaming habits of consumers entitled “Is Netflix the ‘Facebook’ of Streaming Services?” based on our monthly surveys of consumers to examine demographic similarities between streaming and social media audiences. Now, we’ve come back to see if the arena has changed.
Previously
As an answer to the titled question, we found that Netflix, despite being the most subscribed and well-known of the streaming services, did not completely match Facebook's demographic breakdown. Netflix, like Facebook, does share demographic characteristics closer to the general population unlike many other streaming services. However, based on an age comparison, Amazon Prime Video was a closer match to Facebook,
We uncovered some surprising connections. For example, Instagram showed similarities to Disney+ and Hulu, while Twitter (now X) looked like HBO Max and Apple TV+. We also saw competitive dynamics, such as how younger platforms like TikTok vie for Facebook’s target audience and services like Disney+ challenge Netflix subscribers.
We compiled those insights using only our monthly surveys back in late 2022 and early 2023, but now that we have newly updated media consumption models, we are excited to see what new insights we can find!
Methodology
This time, rather than using only survey methodology to make our comparisons, we used our media consumption models and universes to better examine the segments of likely streamers and social media users and the market itself.
Given the different sources of data, we can’t provide an apples-to-apples comparison of consumers and their relationship to social media or streaming services. Nevertheless, the comparisons give interesting insights into the new media landscape itself.
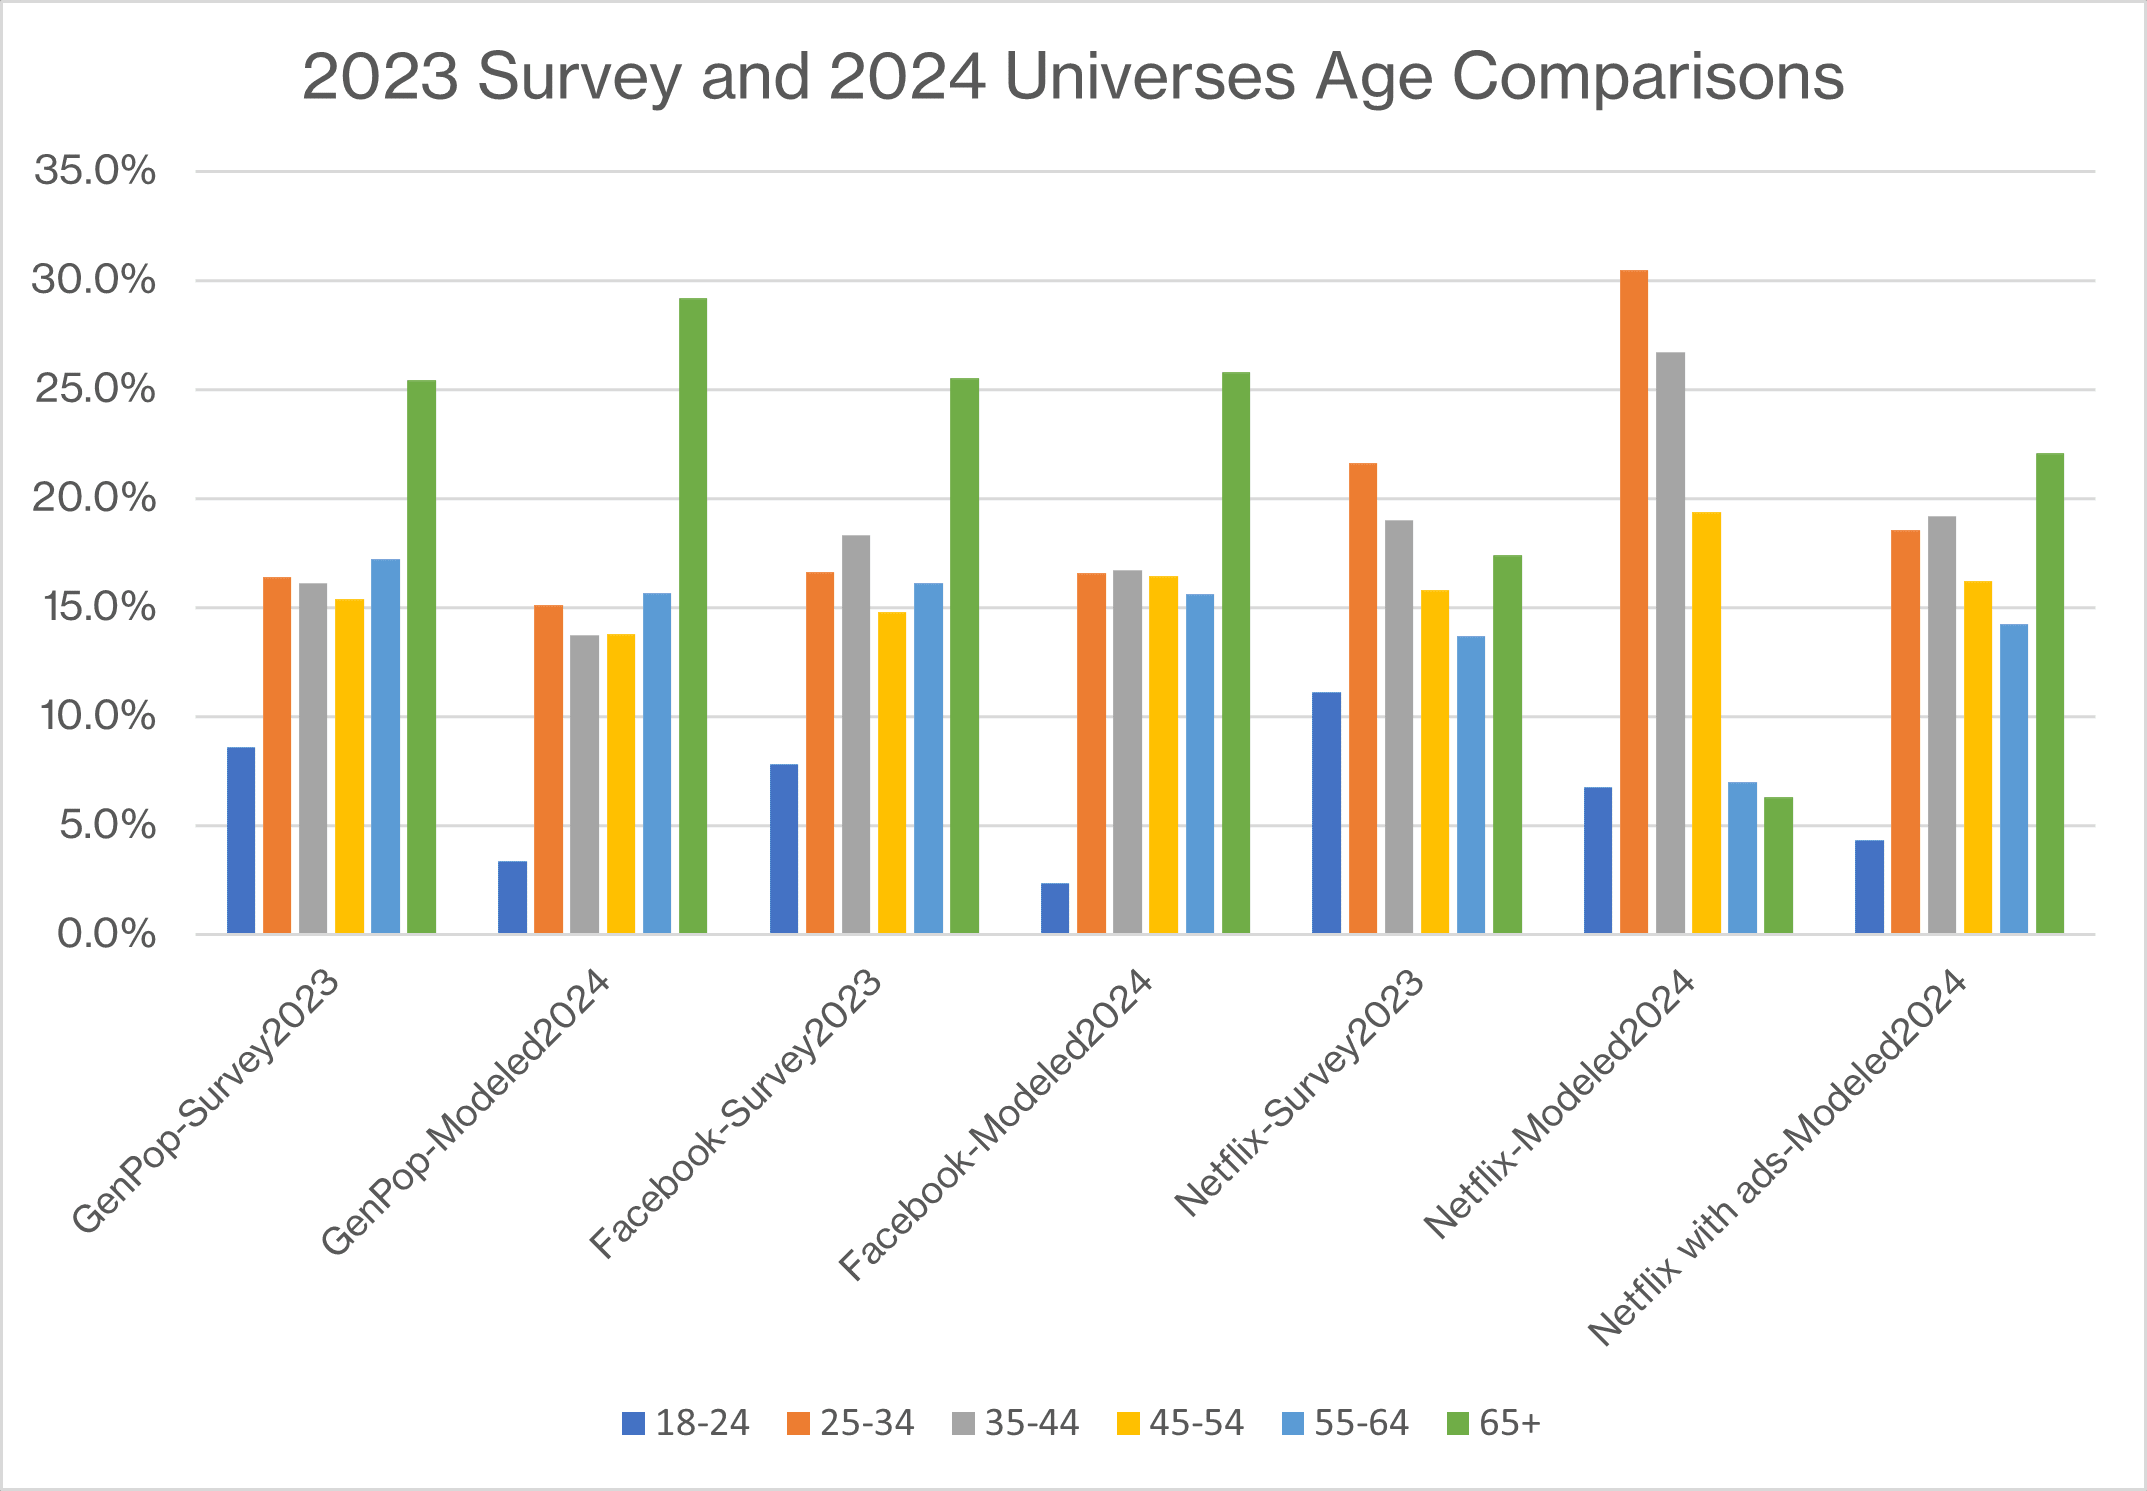
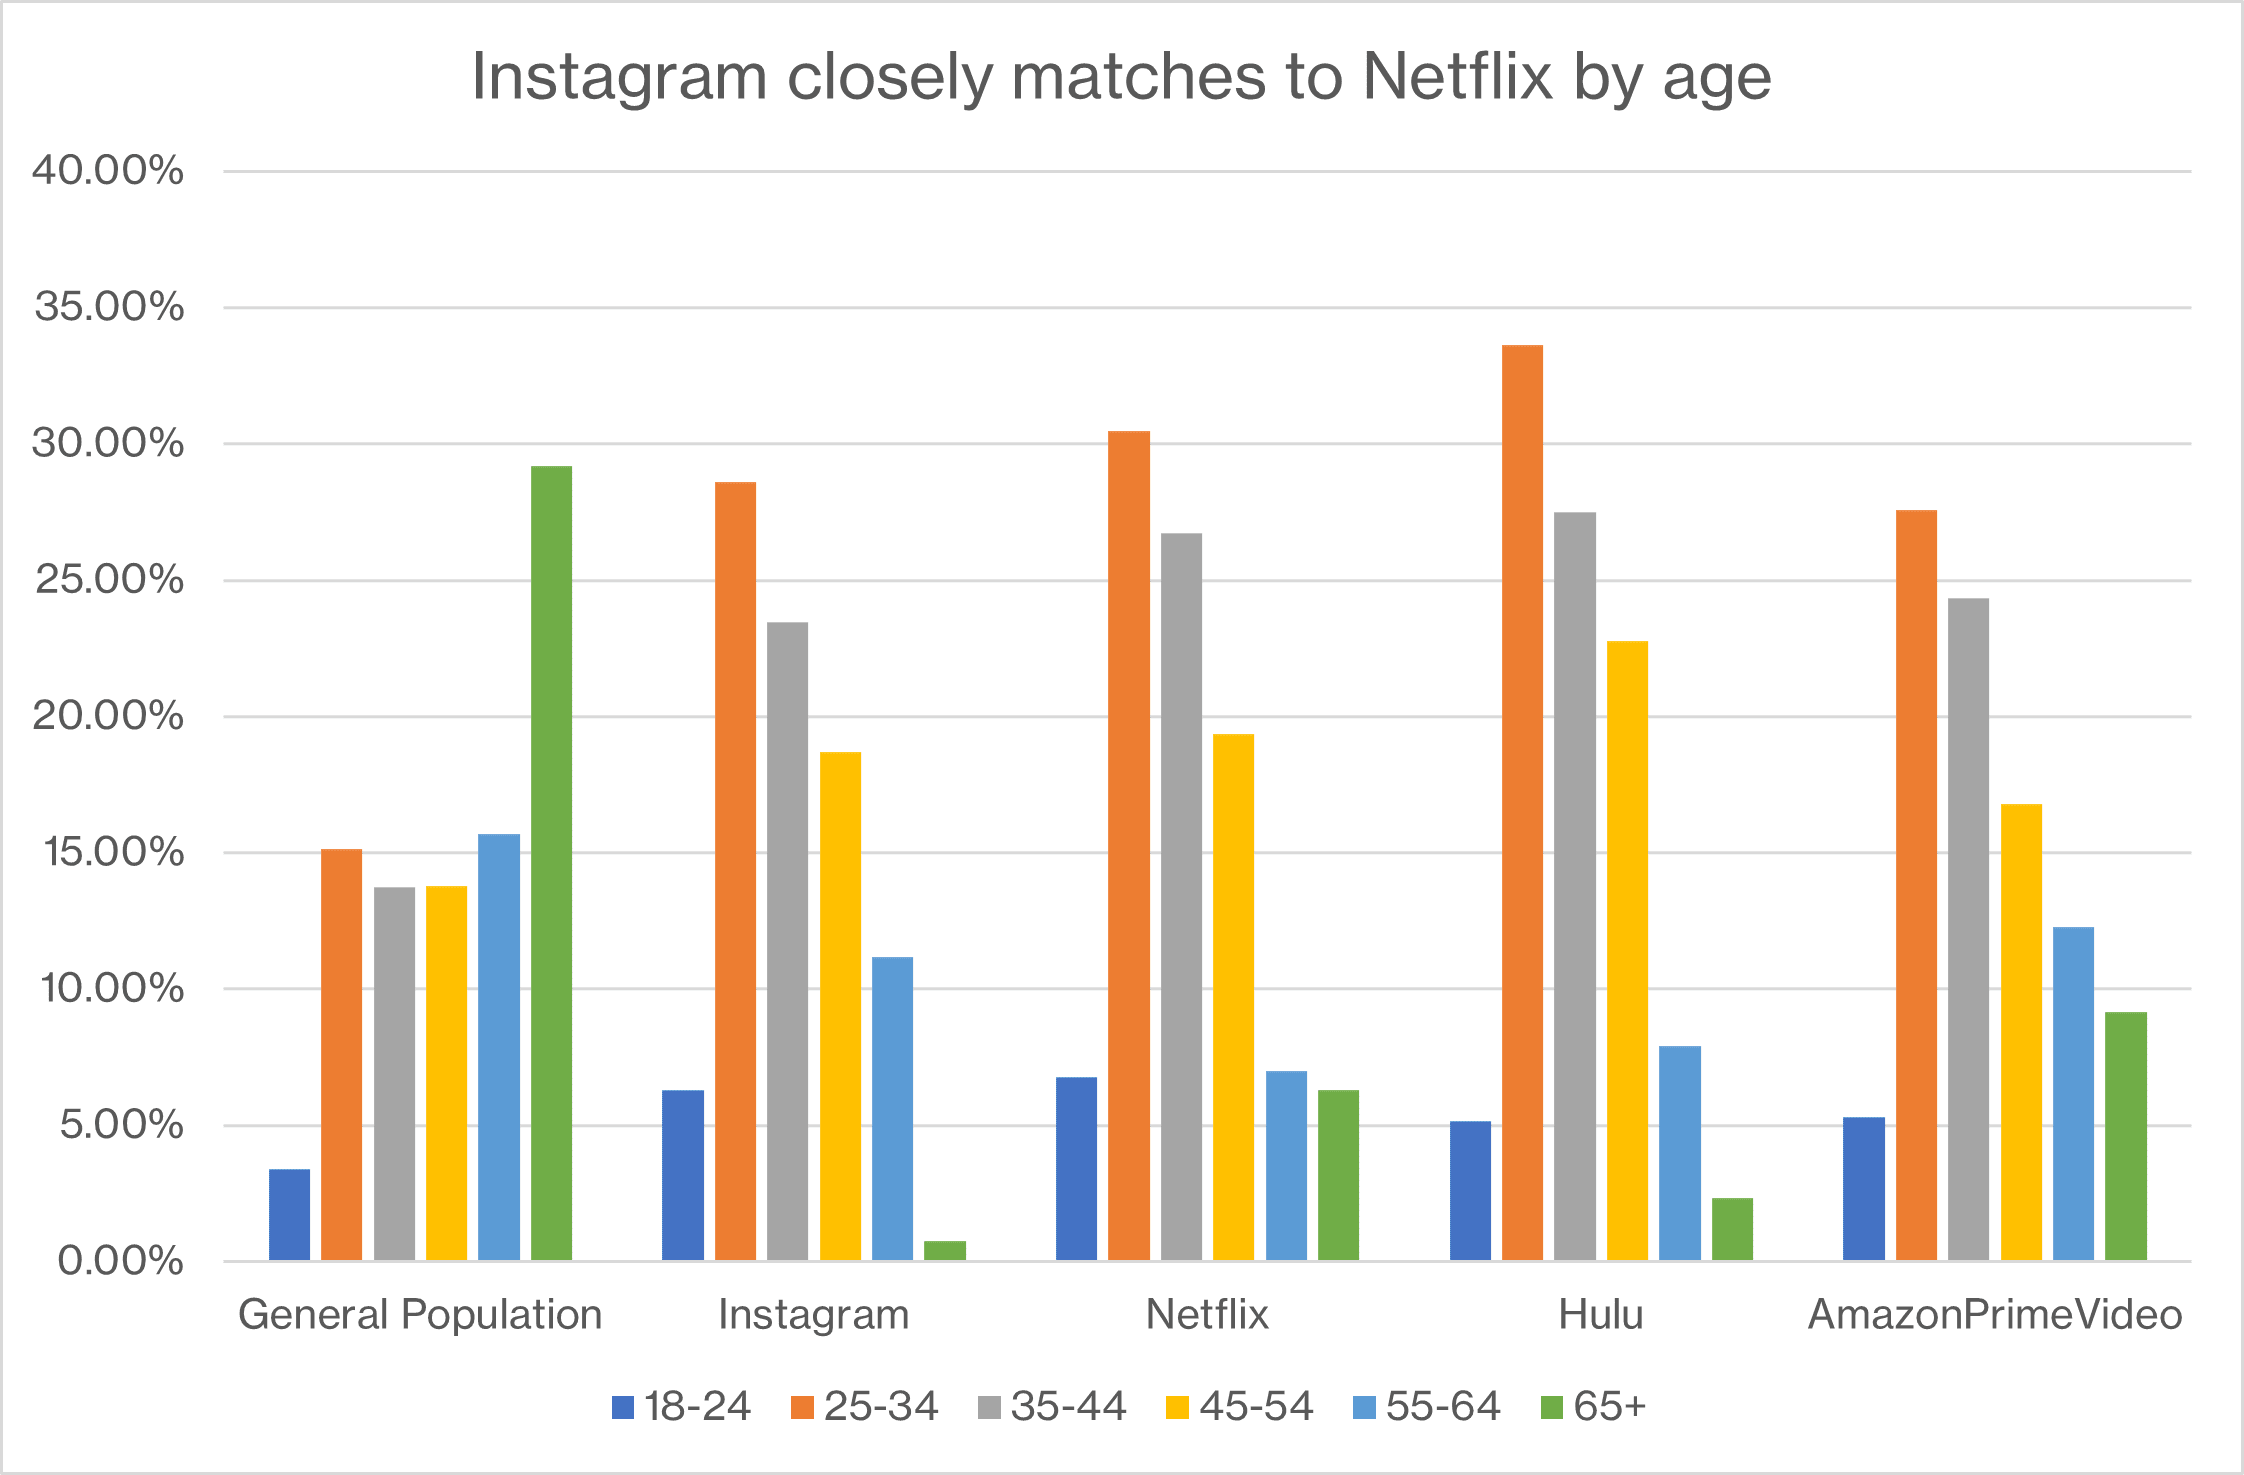
When comparing the age breakdowns of our weighted 2023 survey with our current modeled universes, we see both similarities and differences. While the matches to the weighted survey population remain consistent, discrepancies arise when including consumers who are likely to purchase the ad-supported offering.
Facebook and the general population, which also closely matched each other in the previous study, saw little change in age outside of a decrease of 18–24-year-olds. Meanwhile, although Netflix subscribers in early ‘23 spanned a range of ages, our modeled audiences - whether opting for ads or not – revealed significant differences in the age breakdowns.
Is Netflix the Facebook of Streaming Services?
As we asked back in 2023, is Netflix the Facebook of Streaming Services? Although we could not definitively say “yes” at that time, we can see from the current universes that the comparison is slightly more apt today, at least if you watch Netflix with ads. Previously, we saw that Amazon Prime Video watchers were slightly closer to the demographic breakdown of Facebook users. Today, although demographically closer than most streaming services, Amazon Prime now has become the second closest behind Netflix with ads.
Netflix with ads is the only service that has a significant number of adults 65+ that even vaguely resembles Facebook and the general population, as seen below.
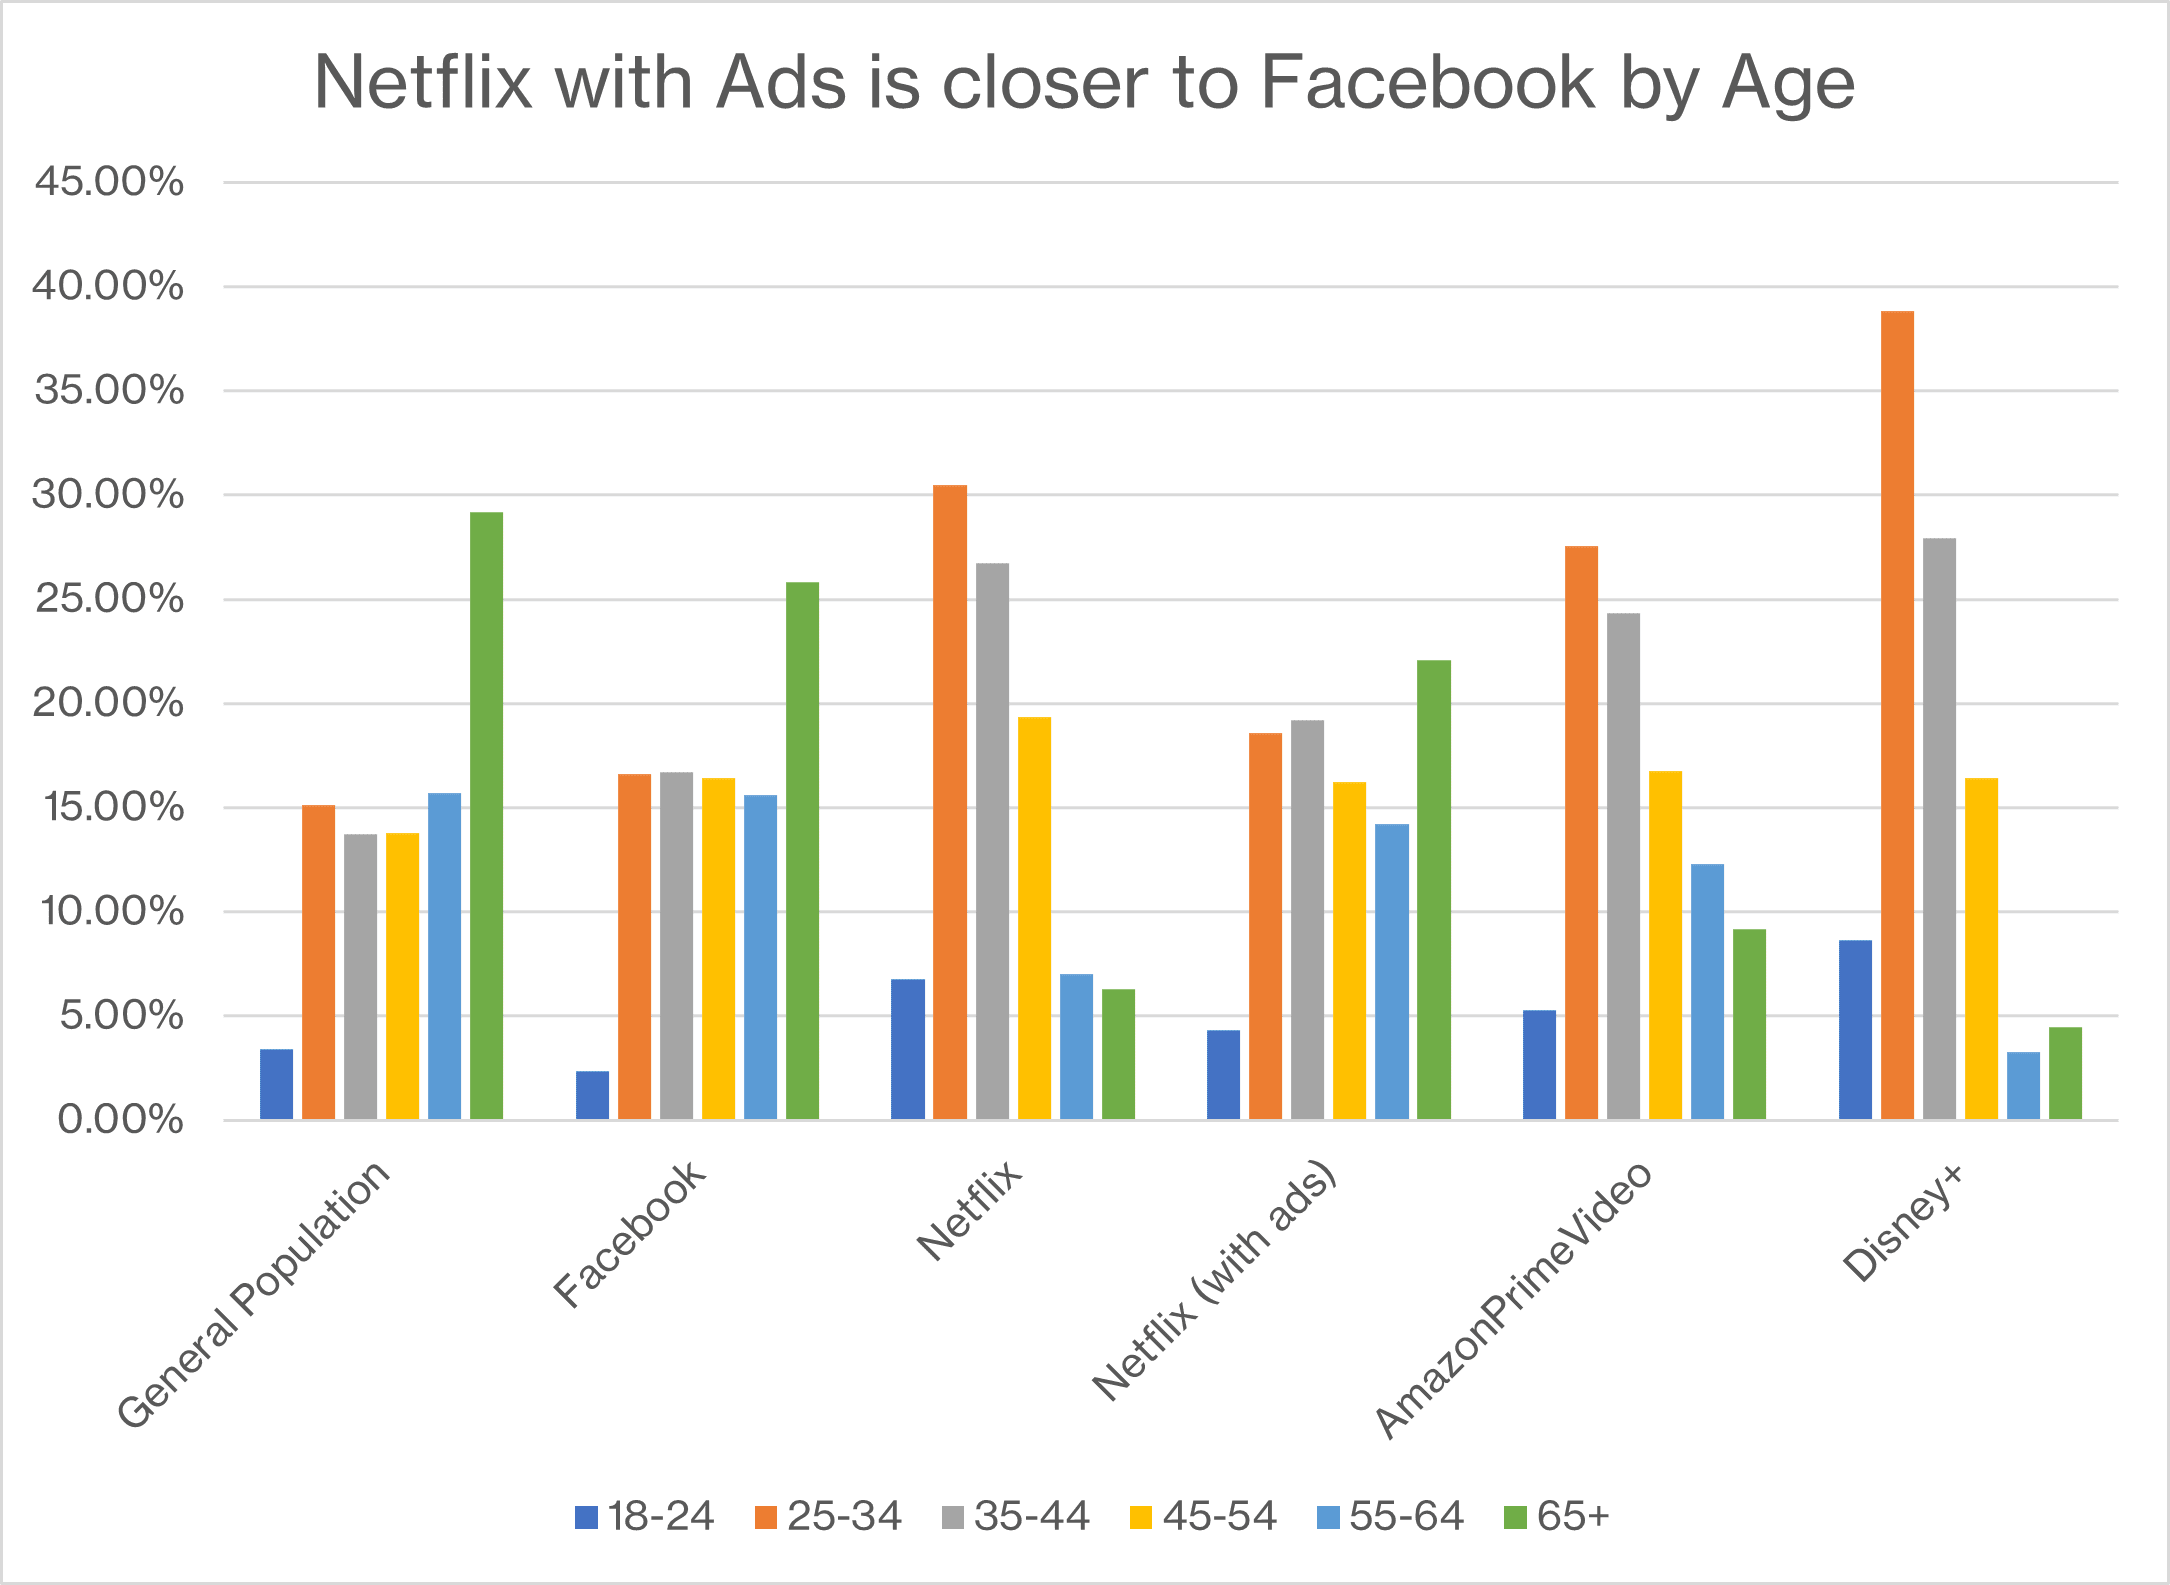
Even with time and new ad tiers, streaming services still don’t reflect the age demographics of social media platforms on a 1-to-1 basis.
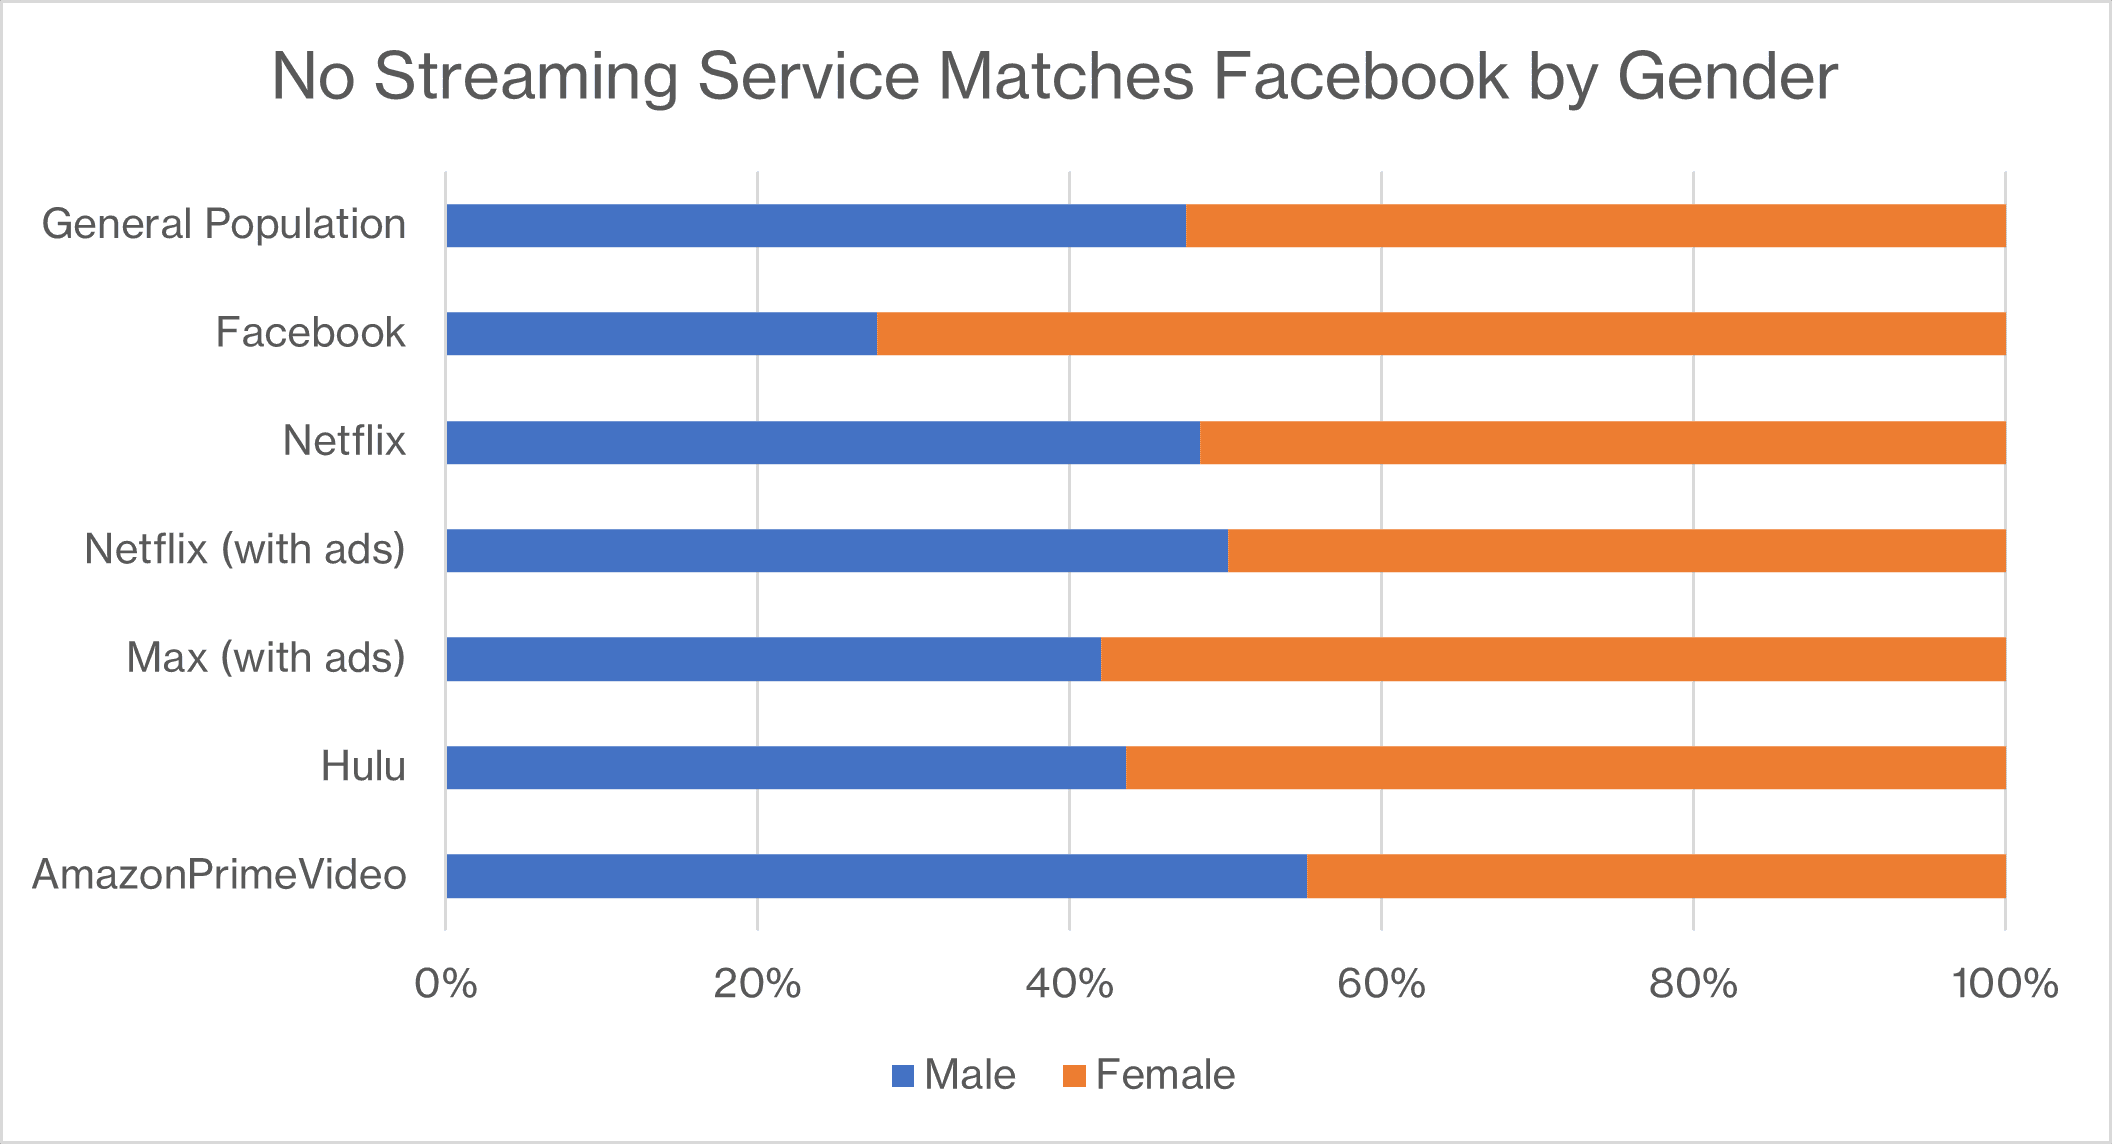
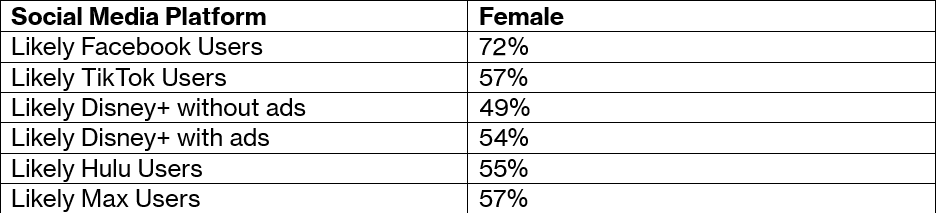
As for the gender breakdown, likely Facebook users skewed overwhelmingly female at about 72% against the general population’s 52%. No steaming service came close to Facebook’s gender breakdown, although several came close to the general population’s. Netflix without ads came closest to the general population, while Max with ads came closest to Facebook at 57% female.
What is the TikTok of Streaming Services?
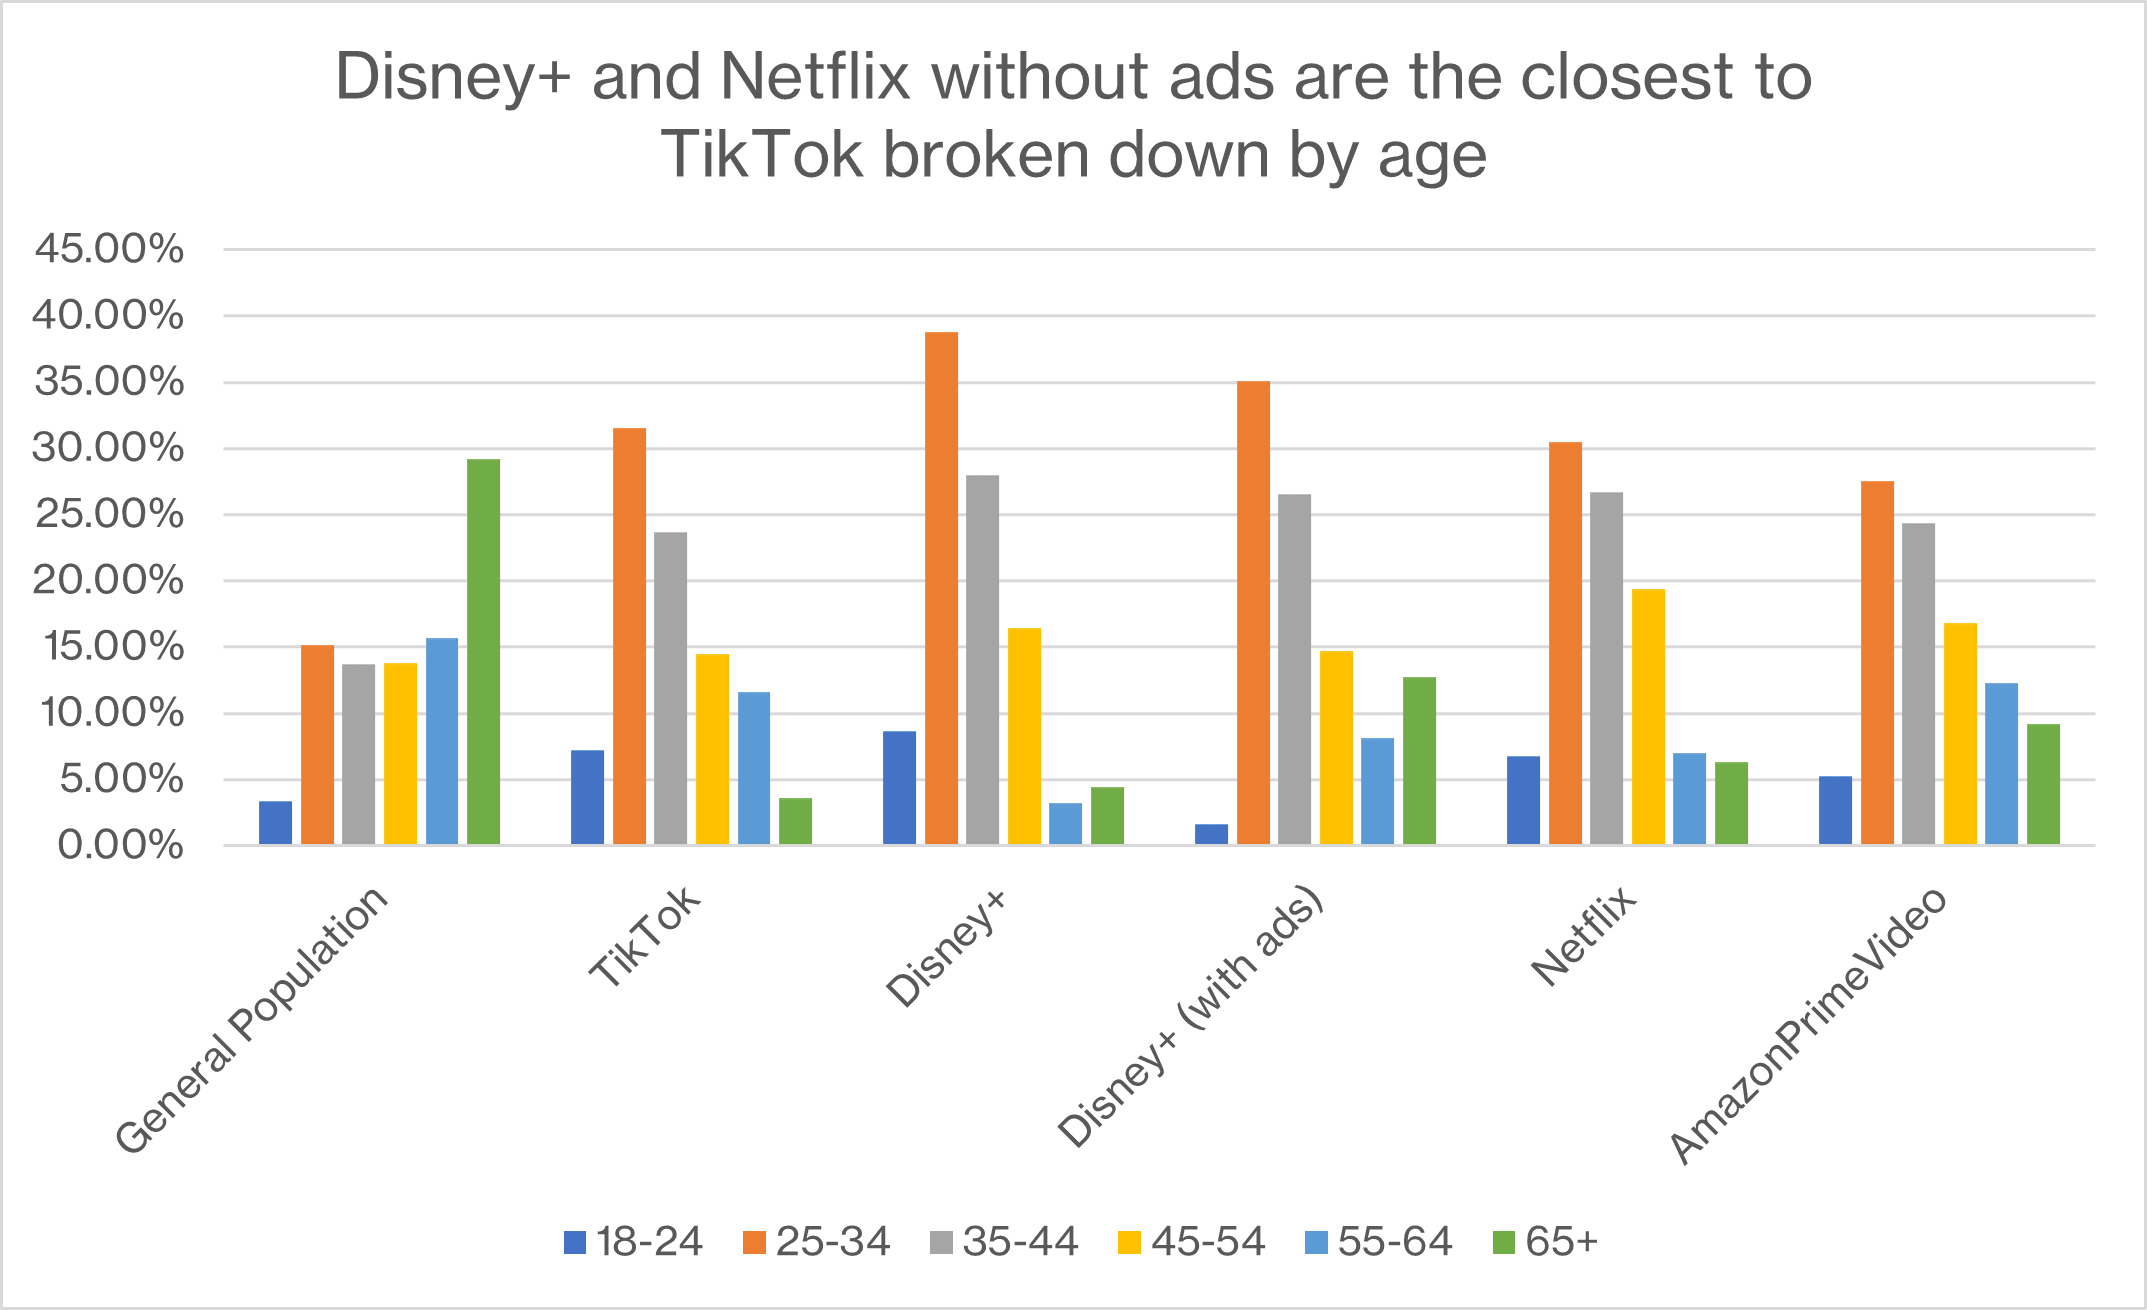
Likely TikTok users, unsurprisingly, skew significantly younger than the general population, with about twice as many users aged 18-24 and only 4% aged 65+. Although many streaming service users are younger than the general population, not as many were able to match the rate of 18–24-year-old users from TikTok. The closest streaming service matches were Disney+ without ads and Netflix without ads, with 9% and 7% 18-24-year-old users respectively. Adding an ad tier into the mix appears to change this breakdown, with Disney+ with ads only having 2% of users aged 18-24.
Likely TikTok users and likely Facebook users both skew female, but Facebook is ahead of all other options at 72%. You can see how other platforms did with women in the table below.
With conflicting matches between likely TikTok users and specific streaming service viewers, no streaming service appears to be the direct “TikTok of streaming services,” although streaming services have gotten closer to capturing that younger audience than they did 2 years ago.
Other Group Crossovers
As we reported in our first analysis, we also looked at other comparisons between certain streaming services and specific social media platforms, including Instagram and X.
The Instagram Group
Matching likely Instagram users to a streaming service audience, we found that Netflix is more likely to be the “Instagram of streaming services.” By age, likely Instagram users are very similar to likely Netflix without ads except for 65+.
By gender, Instagram users, like TikTok, skew female, more closely matching the gender breakdowns of likely Disney+ without ads users and Max without ads users.
The X Group
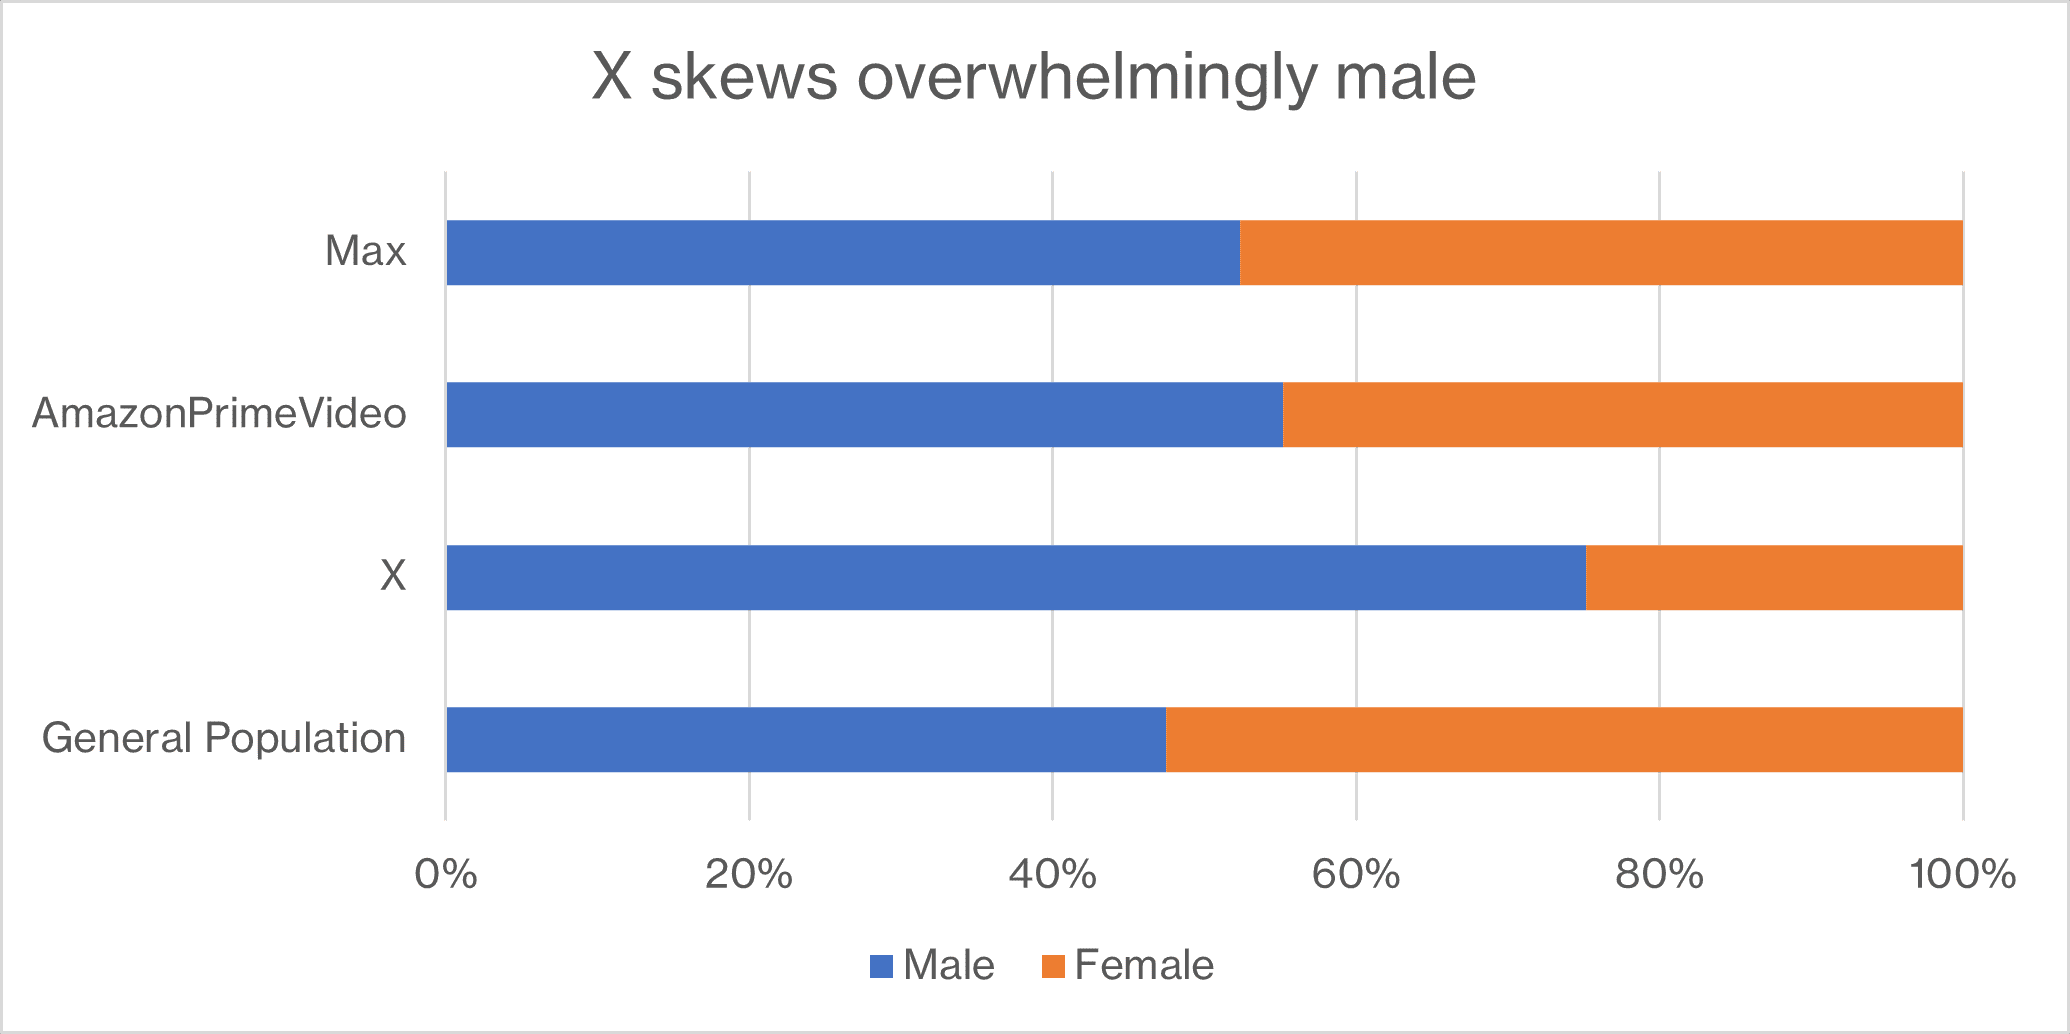
Likely X users skew overwhelmingly male at 73%. No gender breakdown of any likely streaming service users we looked at came close to that breakdown.
Other Universe Crossovers
Our models also allow us to look at other traits and habits of consumers between social media users and streamers. Although demographically Netflix with ads could be the “Facebook” of streaming services, will those similarities also appear when comparing the rates of streamers with children in the house, their attention to social media influencers, or the likelihood to exclusively watch television through streaming services?
Children in Household
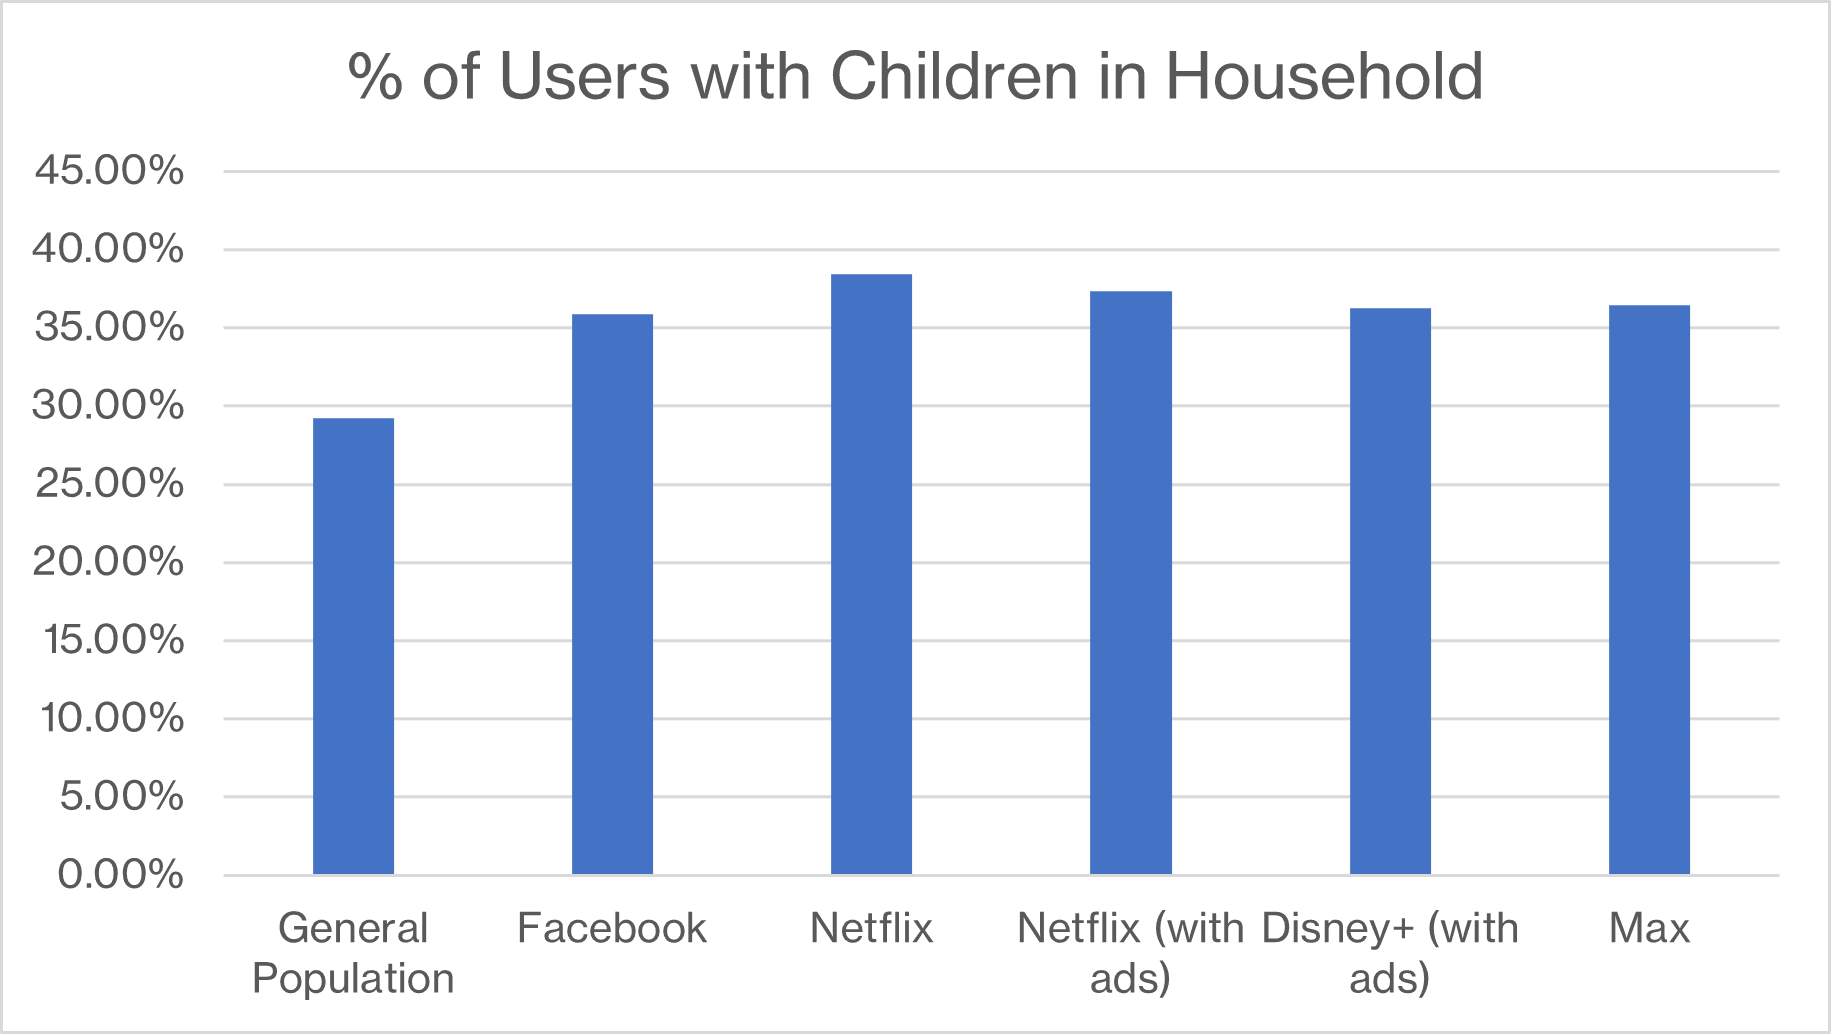
We found that the proportion of households with children was higher among both likely streaming service viewers and social media users compared to the general population. Thirty-six percent of likely Facebook users have children in the household. This is similar to several other streaming audiences, including likely Netflix viewers (38%), Netflix viewers with ads (37%), Disney+ viewers with ads (36%), and Max viewers without ads (36%). However, not all streaming services had similar rates: 40% of likely Hulu viewers without ads and only 28% of likely Max viewers with ads reported having children in the household.
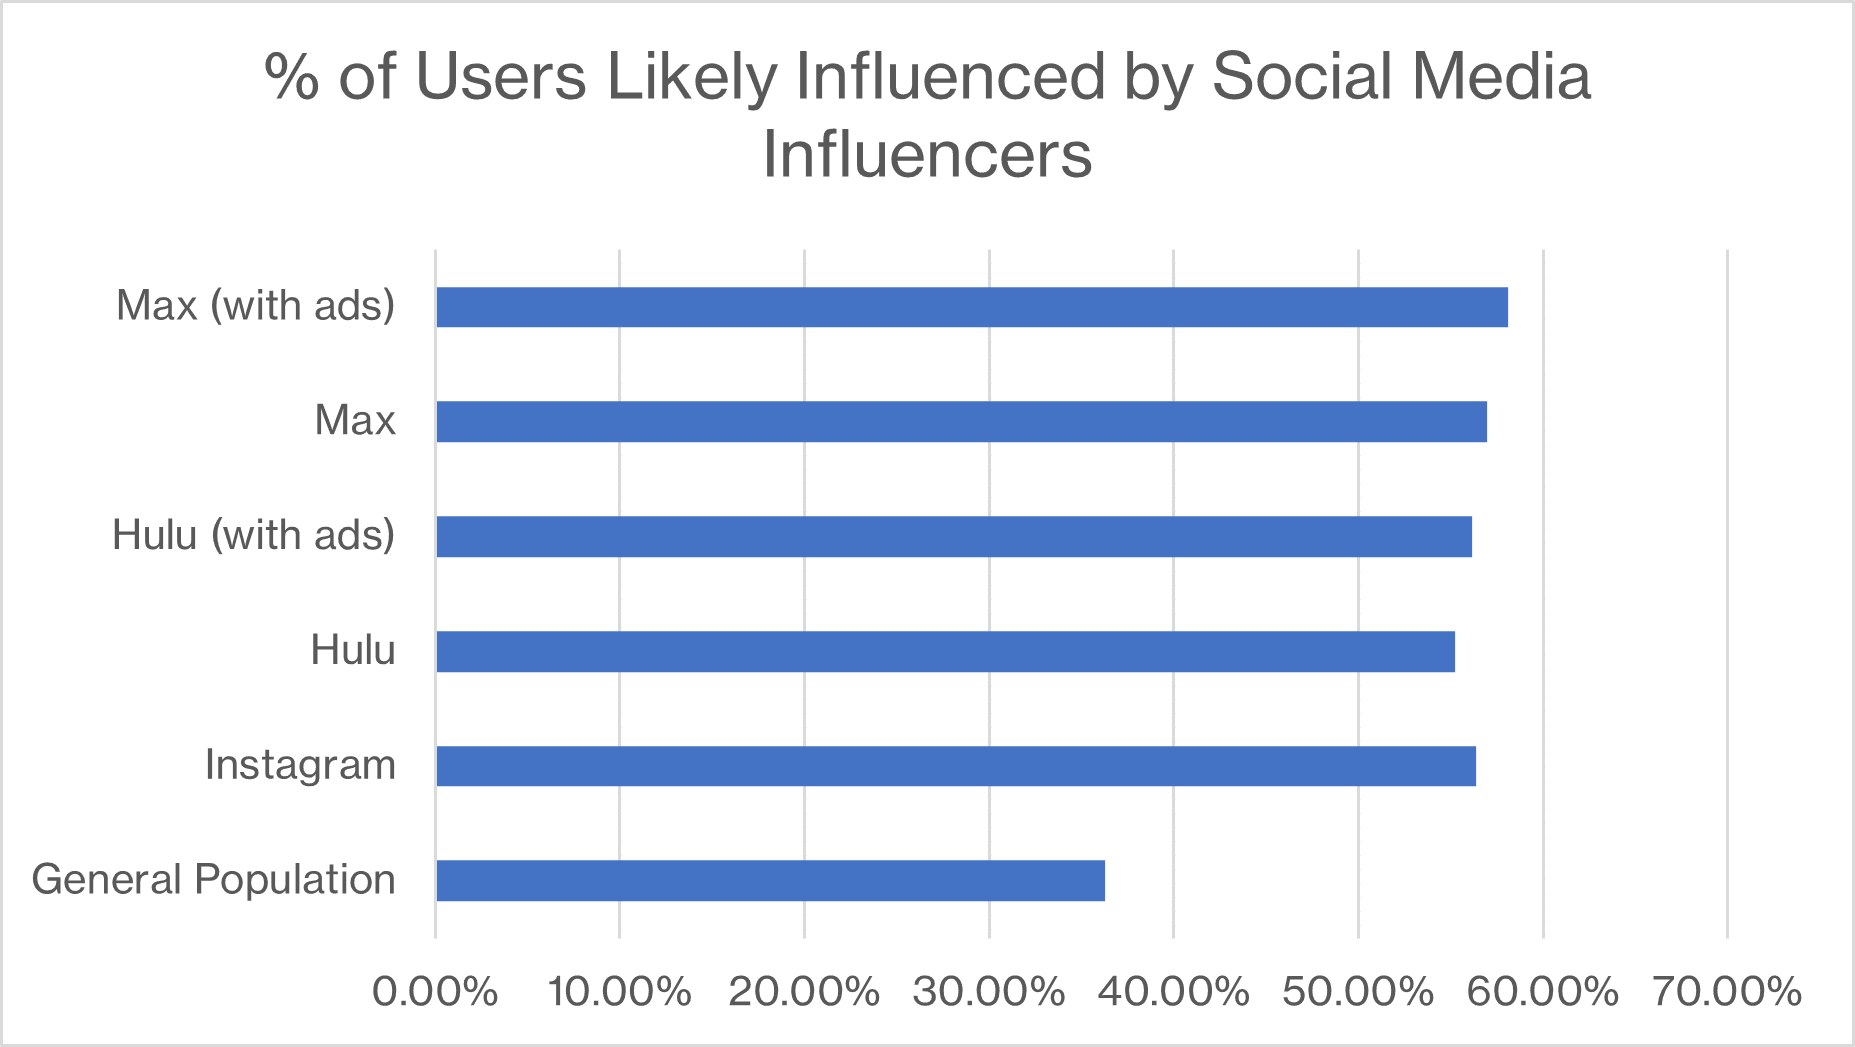
Influenced by Influencers
We also created a universe of consumers likely to be influenced by social media influencers and cross-referenced this with our social media and streaming service data. We found that likely Facebook users were less influenced by social media influencers compared to likely Instagram users—44% versus 56%—though both figures are higher than the general population rate of 36%. Despite focusing on streaming habits rather than social media habits, our streaming service audiences exhibited higher rates of being persuaded by influencers compared to both Facebook and X, with some even surpassing likely TikTok users. The highest influence rates were observed among likely Max viewers, with 58% for those with ads and 57% for those without ads.
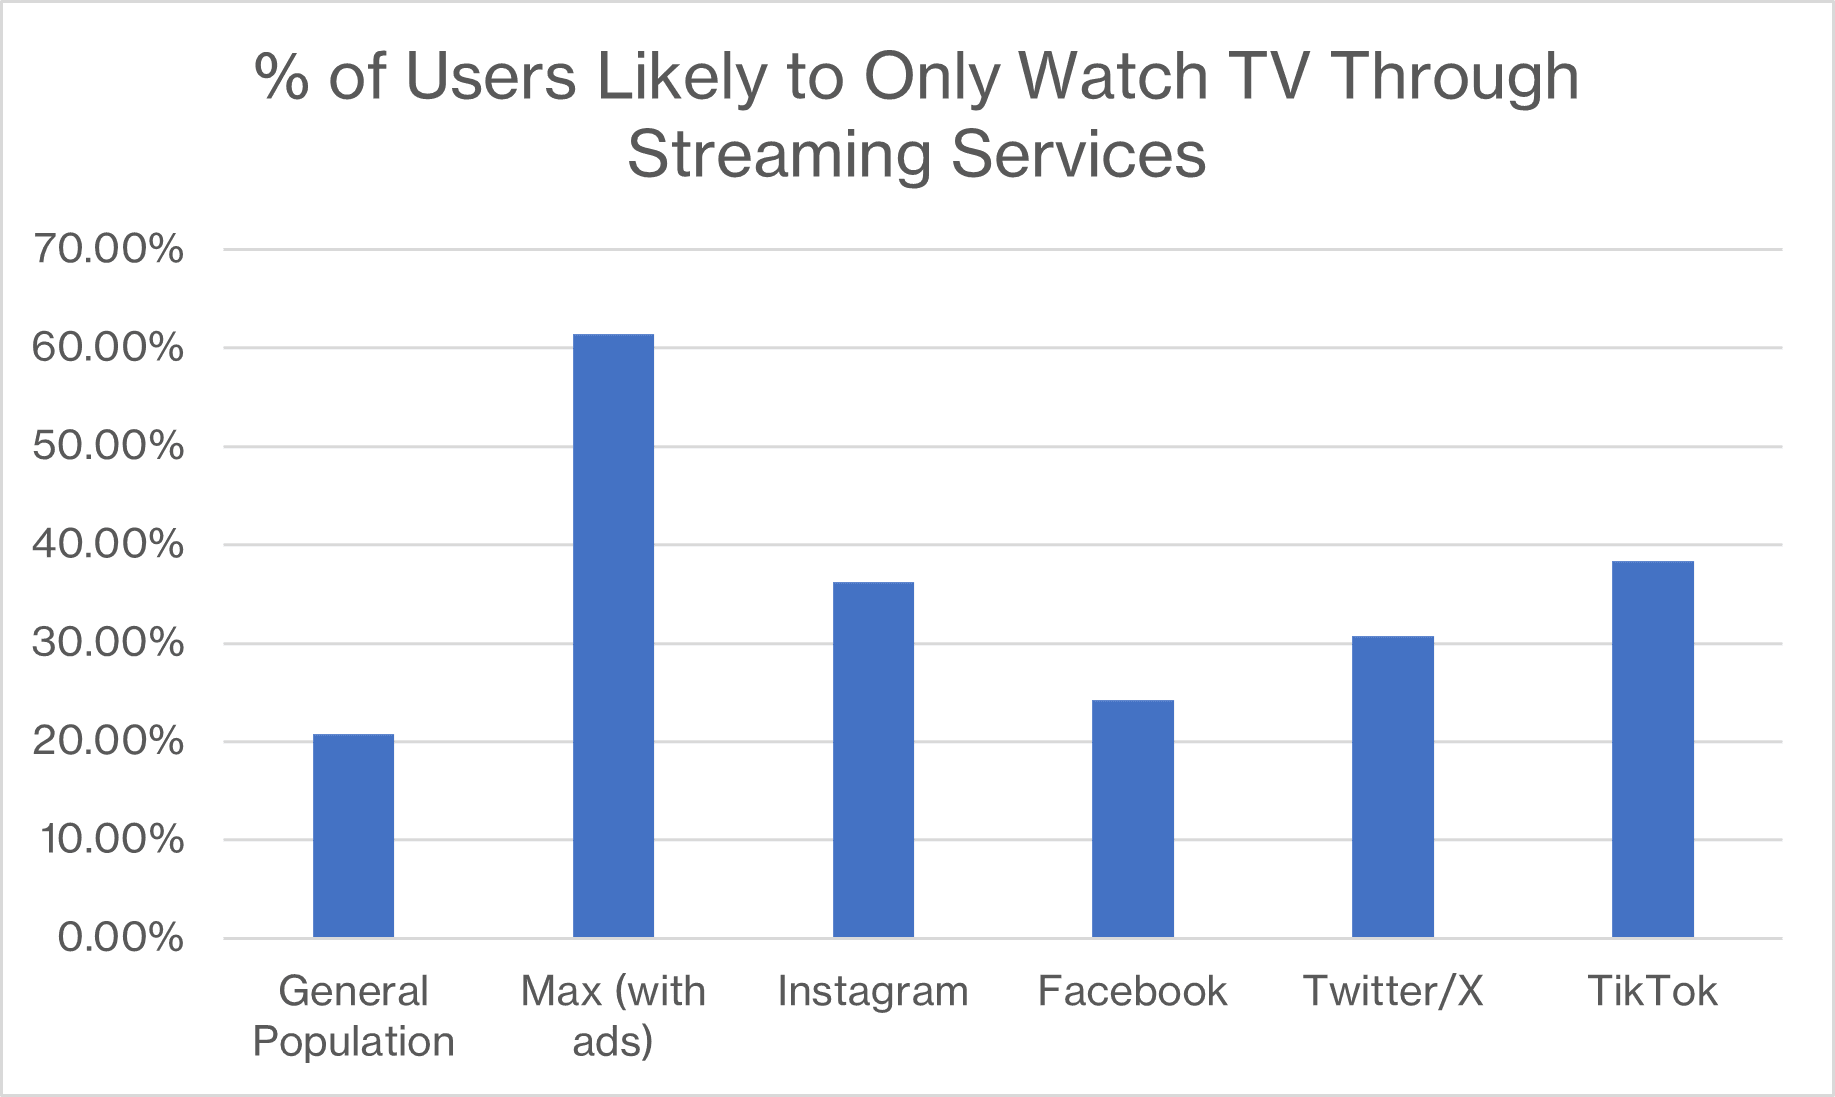
Streaming Only Group
On the other side, we created universes of consumers who only consume television through streaming services (a.k.a. “cord-cutters”) and crossed that universe with some of our social media users. Here, unlike the previous universe, we did not see as much crossover between the two, although all likely social media users were more likely to be cord-cutters than the general population. Likely Max with ads viewers had the highest rate at 61%, while likely Instagram and likely TikTok users had the highest rate among likely social media users at 36% and 38%.
Conclusion
While Netflix still may not fully fit the label of the “Facebook of streaming services,” there is a closer demographic match between likely Netflix viewers with ads and likely Facebook users compared to general Netflix users surveyed nearly two years ago. Although the correlation isn't perfect, the use of models and broader data sets has revealed intriguing new insights. For instance, likely streamers appear to be just as, if not more, influenced by social media influencers compared to Instagram users, despite not having a direct 1-to-1 match with social media platforms. While the definitive comparison we sought two years ago may remain elusive, our findings have uncovered new questions and insights that pave the way for identifying and targeting the right audiences with the right messages.
Get insights from our new Causeway Media Connection to refine your marketing and advertising program—including streaming services, social media, TV, radio and more. Find out how to reach your target audiences and strengthen your marketing strategies, while reducing waste and advertising spend. Contact us at [email protected].
To learn more, visit Causeway Solutions to get started!