Who Actually Watches Ads?
Lauren Kornick
Analytics, Digital Targeting, Connect with Causeway
September 6, 2022
Who Actually Watches Ads?
Political season is upon us and with that season comes a plethora of political ads. Ads promoting name recognition, important issues, reminders to vote, and more flood different devices at various rates depending on the standing of the race, the location, and, of course, the person viewing the ad. Bloomberg predicts that political ad spending for midterms is set to hit a record of $9 billion with Axios predicting $3 billion going into digital ad spending specifically. Ads will get to screens and eyeballs with that spending (and some helpful targeting), but who will likely pay attention to ads in general?
As part of our new podcast, Connect with Causeway, we conducted a survey of 1500 respondents to measure their attitudes and behaviors. In the latest episode, we break down some trends we found specifically concerning ad targeting and media behaviors. We found that 82% of respondents said that they were more likely to pay attention to ads if they were targeted to their interests. Over 50% stated that they at least sometimes paid attention to ads on social media, web browsers, traditional tv, and streaming tv, but only about 20% regularly or always pay attention to them. Accurate and reliable targeting could help to reach that less attentive 30 or 40% (hear more of our commentary on the podcast), but who are the in-the-bag viewers who will likely already watch your message no matter what? And how much does the platform for the message come into play?
Social Media Ad Viewers
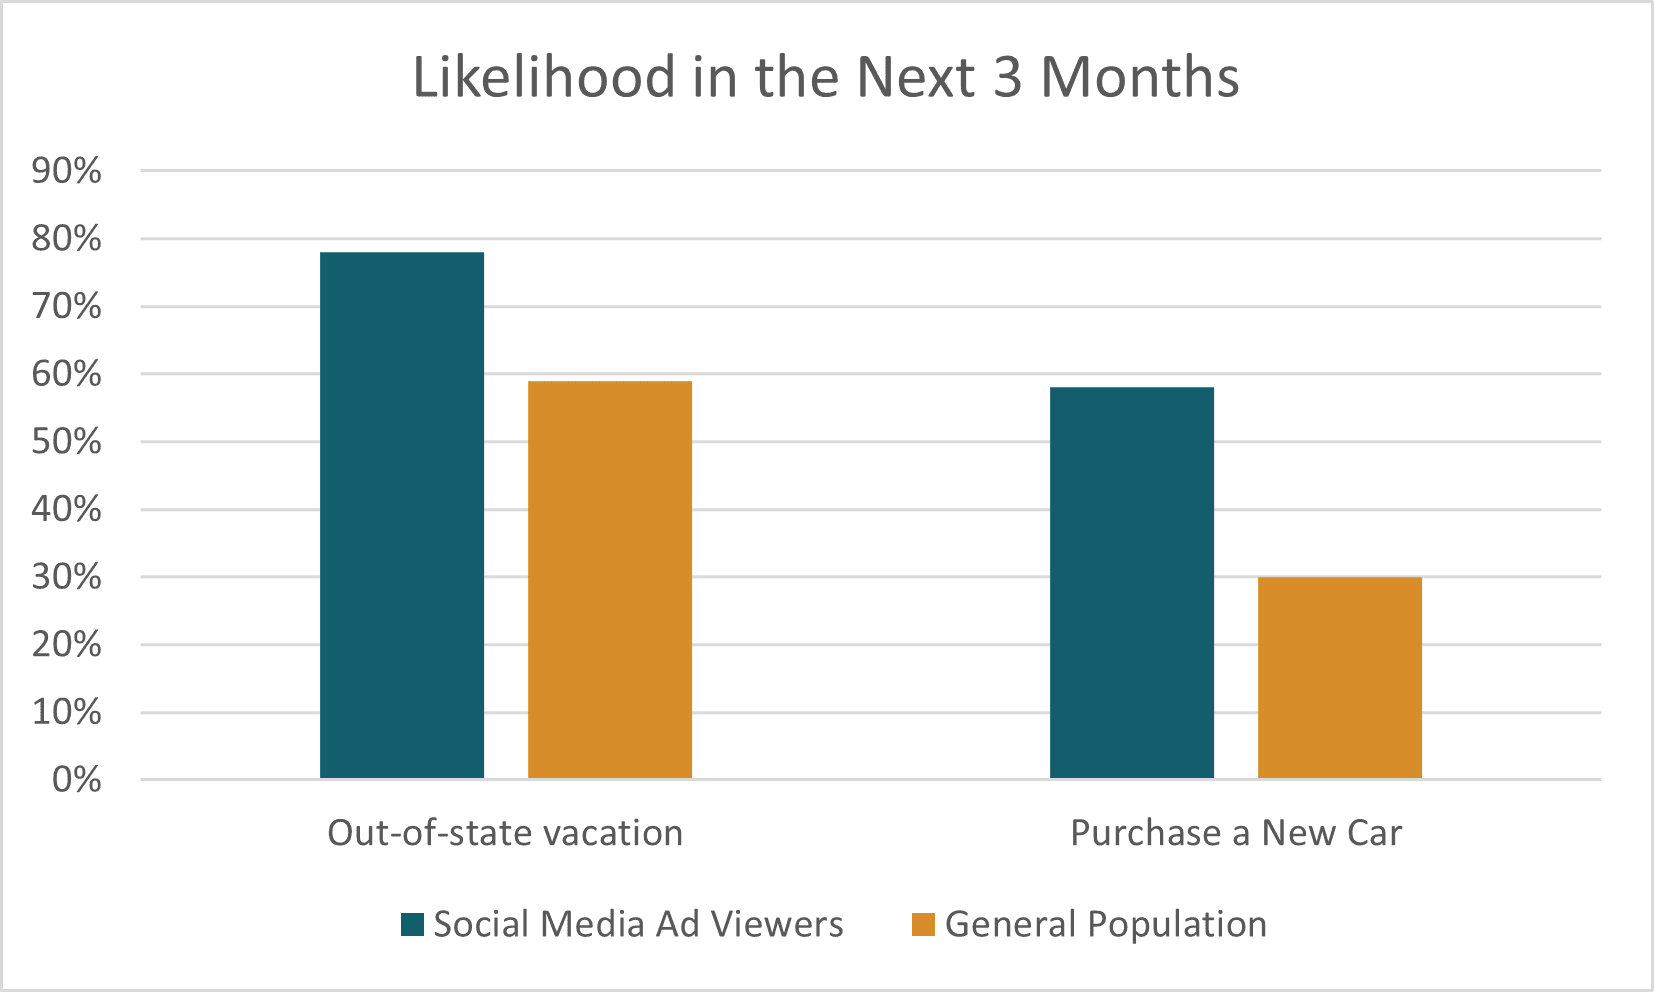
24% of respondents stated that they always paid attention to social media ads. Unsurprisingly, they skew younger, with 48% being under 35, and they are also slightly more male and diverse than the general population. Notably, they are also slightly wealthier, and they seem to use their extra money for trips and larger purchases, possibly from the ads they’ve seen from scrolling through Instagram or Facebook. 78% said it is likely they will go out of state for a vacation within the next three months, and 58% said they were likely to purchase a new car.
They also seem more adventurous and ready for public events, with 34% saying they are very likely to take an international flight compared to only 13% of the general population and 64% planning to attend live sports events. They are also more tuned in to their screens, with 96% subscribed to at least one streaming service and 62% spending 4 or more hours on their phone every day. Their online community of choice? Facebook at 84%, followed by YouTube at 74% and Instagram at 70%.
Traditional TV Ads
A smaller but not insignificant group of ad viewers are the traditional tv ad viewers, who make up 18% of the general population. Despite paying attention to what might be considered outdated “traditional” tv, this group’s age range is like the general population’s. This group does skew more male, diverse, likely to be married and have children, and slightly less affluent. Despite having less money to spend, they are ready to make a large purchase within the next three months, with twice as many more likely to purchase a home, a car, or a vacation than the general population. They are also more optimistic about their household finances and the business conditions of the country for the upcoming year.
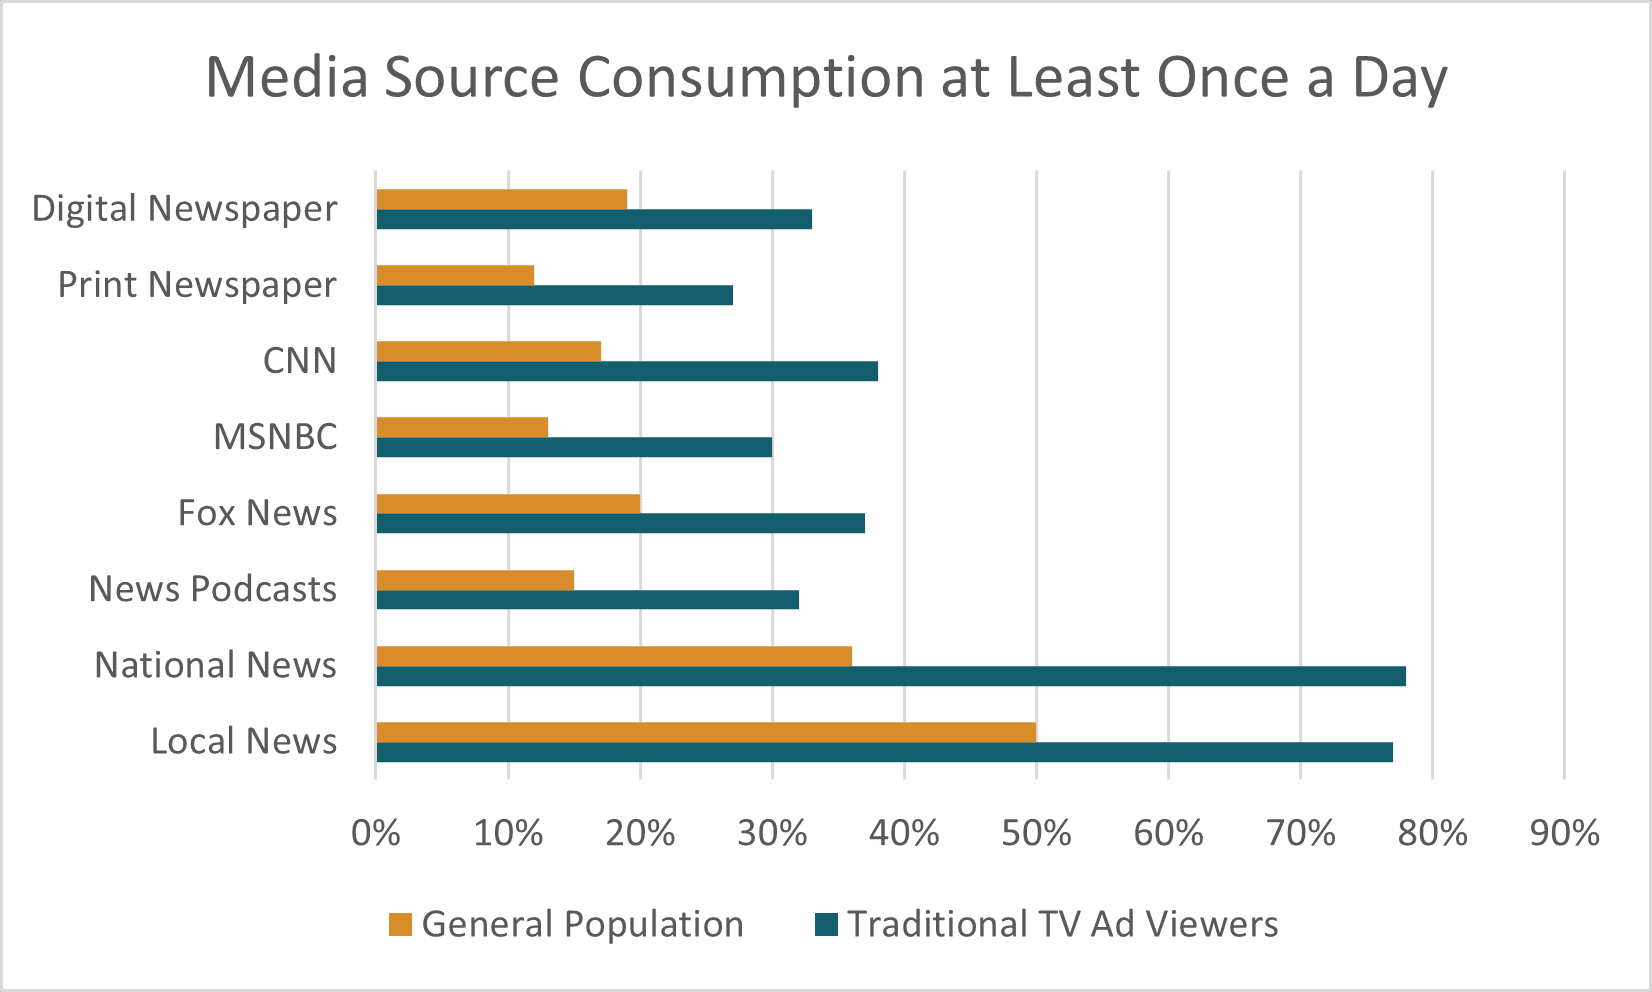
As for viewing habits, they are not prone to using their devices more than the general population, although 33% of them do spend 5 hours or more a day watching television. They subscribe to about the same number of streaming services as the average and are only slightly less likely to be on social media. However, they are still heavy media consumers, and twice as likely or more to consume all tv news, radio news, podcasts, cable news, and newspapers multiple times a day.
Streaming TV Ads
Like traditional TV ad viewers, this group of ad viewers make up a smaller but not insignificant audience of 18% of the total. Like social media ad viewers, they skew younger than the general population, with 42% under the age of 35 and 33% between the ages of 35 and 44. They are also more diverse and only slightly less affluent than the general public but more eager to make a large purchase within the next three months, with 34% saying it is very likely that they will purchase a new car.
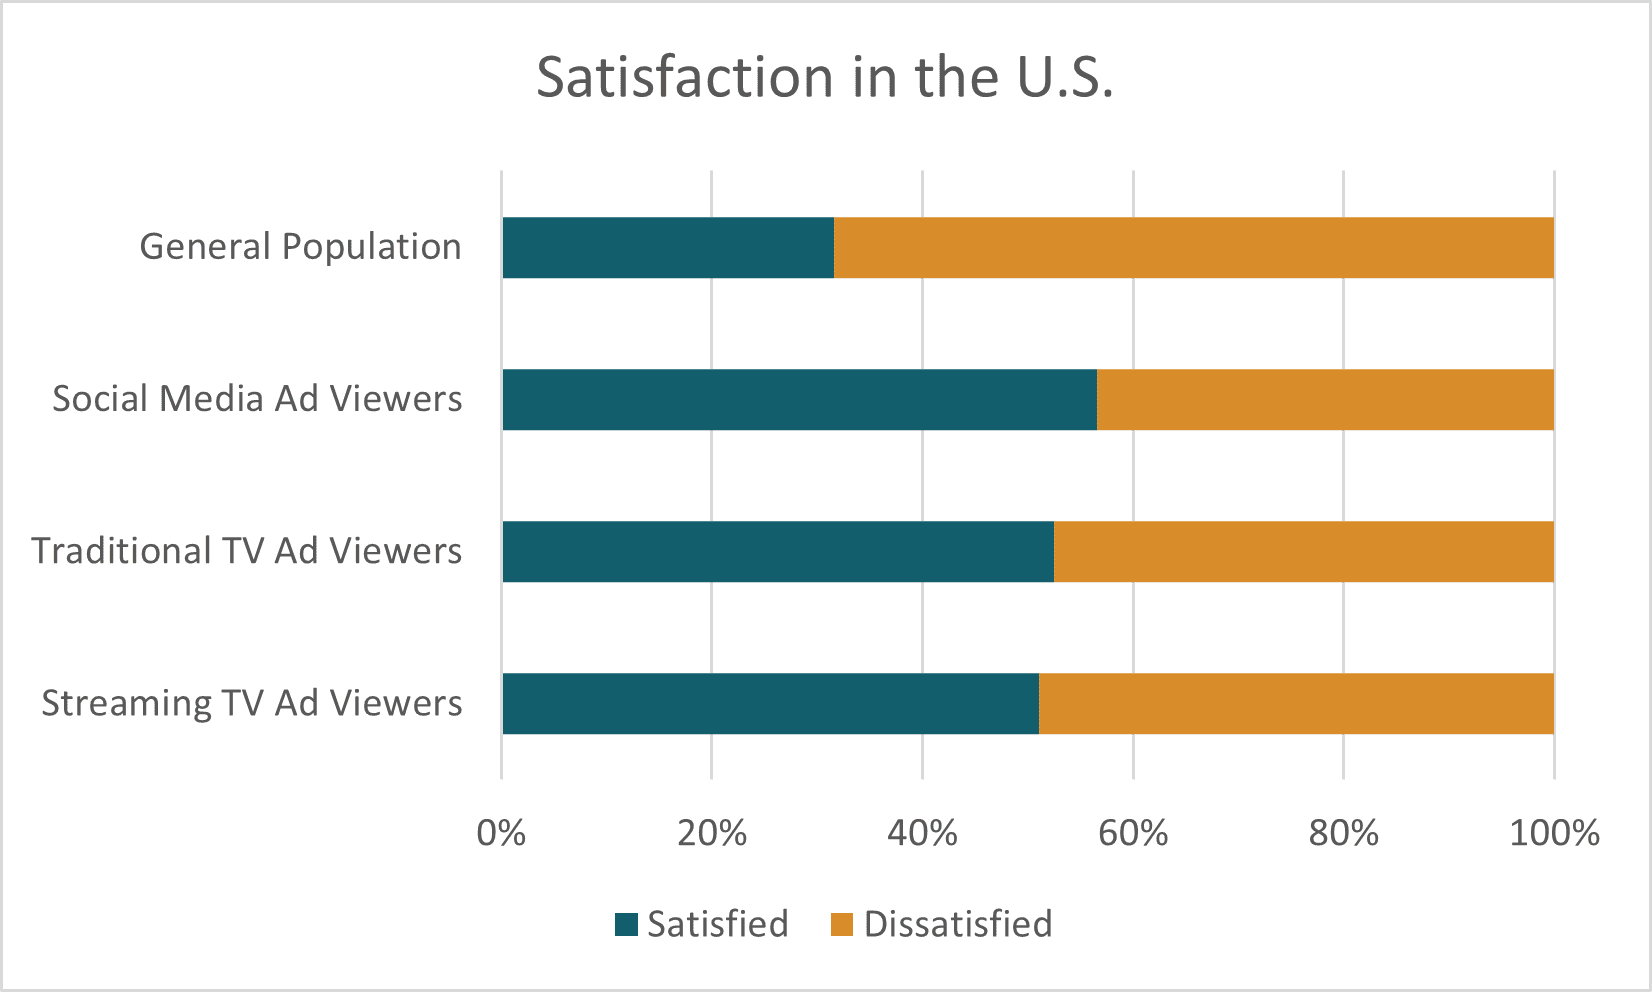
They are just as smartphone savvy as social media ad viewers, with 62% spending 4 or more hours a day on their phones (and 46% 5 hours or more), but they are not as active on social media, although much more active than the general population. They actively use streaming services, with 99% of the group subscribed to at least one streaming service and over 54% subscribed to Netflix, Hulu, Amazon Prime, and Disney+. However, unlike the previous groups, this group of ad viewers is more likely to be split in their attitudes regarding the U.S. today. About half are satisfied with the way things are going while half are unsure or dissatisfied. Despite being more satisfied than the general public, this group’s satisfaction is lower than either TV or Social Media ad viewers.
Conclusion
Ad viewers are actively seeking and responding to ads. They use all sorts of digital platforms ripe for targeting, and, despite any differences in income, they are more actively spending money on the items they want to purchase, whether big or small. They are more optimistic and tuned in to the world around them, including to the content that they want to read or watch. How do you target them? What concerns should you look out for when targeting them? They actively use specific platforms, but how can we make sure that they see the ad AND consume it? This analysis is the first step in a Causeway Solutions analysis. To learn more, contact us, and tune in to our new podcast Connect with Causeway, out September 13th, to get more insight into the world of advertising today.
To learn more, visit Causeway Solutions to get started!